How Generative AI Transforms Data Visualization for Better Insights
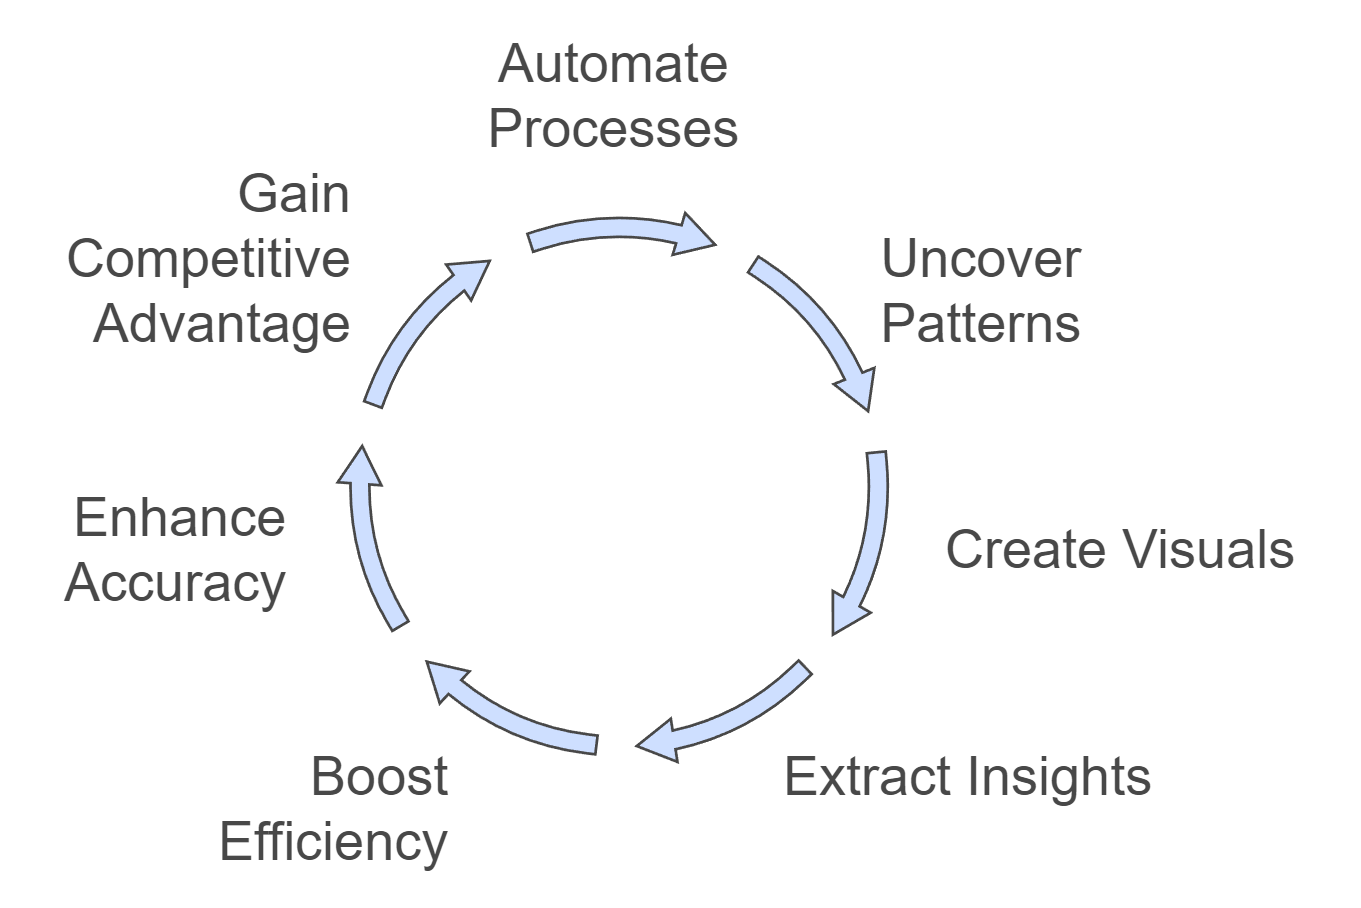
Generative AI is reshaping how you approach data visualization and is a key player in data analytics and generative AI. It automates tedious processes, helping you uncover patterns hidden within vast datasets. By refining raw data into clear, impactful visuals, it empowers you to extract actionable insights that drive smarter decisions. For instance, businesses using generative AI tools save up to 5–10 hours weekly, boosting efficiency. This technology also enhances accuracy by identifying errors in data that might otherwise go unnoticed. Whether you're in healthcare, finance, or retail, generative AI is essential for turning data into a competitive advantage, making complex information accessible and meaningful.
Key Takeaways
Generative AI automates data visualization processes, saving businesses up to 5-10 hours weekly and enhancing overall efficiency.
By utilizing advanced algorithms like neural networks and natural language processing, generative AI uncovers hidden patterns and transforms complex data into clear visuals.
Real-time visualizations powered by generative AI allow for immediate insights, enabling proactive decision-making in fast-paced industries like finance.
Generative AI enhances accuracy by identifying data inconsistencies, reducing human error, and ensuring that visualizations accurately represent the underlying data. Integrating generative AI with tools like Tableau and Power BI streamlines workflows, making data visualization accessible even for those without extensive technical expertise.
Ethical considerations, such as addressing bias and ensuring data privacy, are crucial when implementing generative AI in data visualization to maintain trust and accuracy. The future of data visualization will be shaped by generative AI's ability to create dynamic, interactive narratives that engage audiences and facilitate informed decision-making.
What is Generative AI and How Does It Enhance Data Visualization?
Defining Generative AI
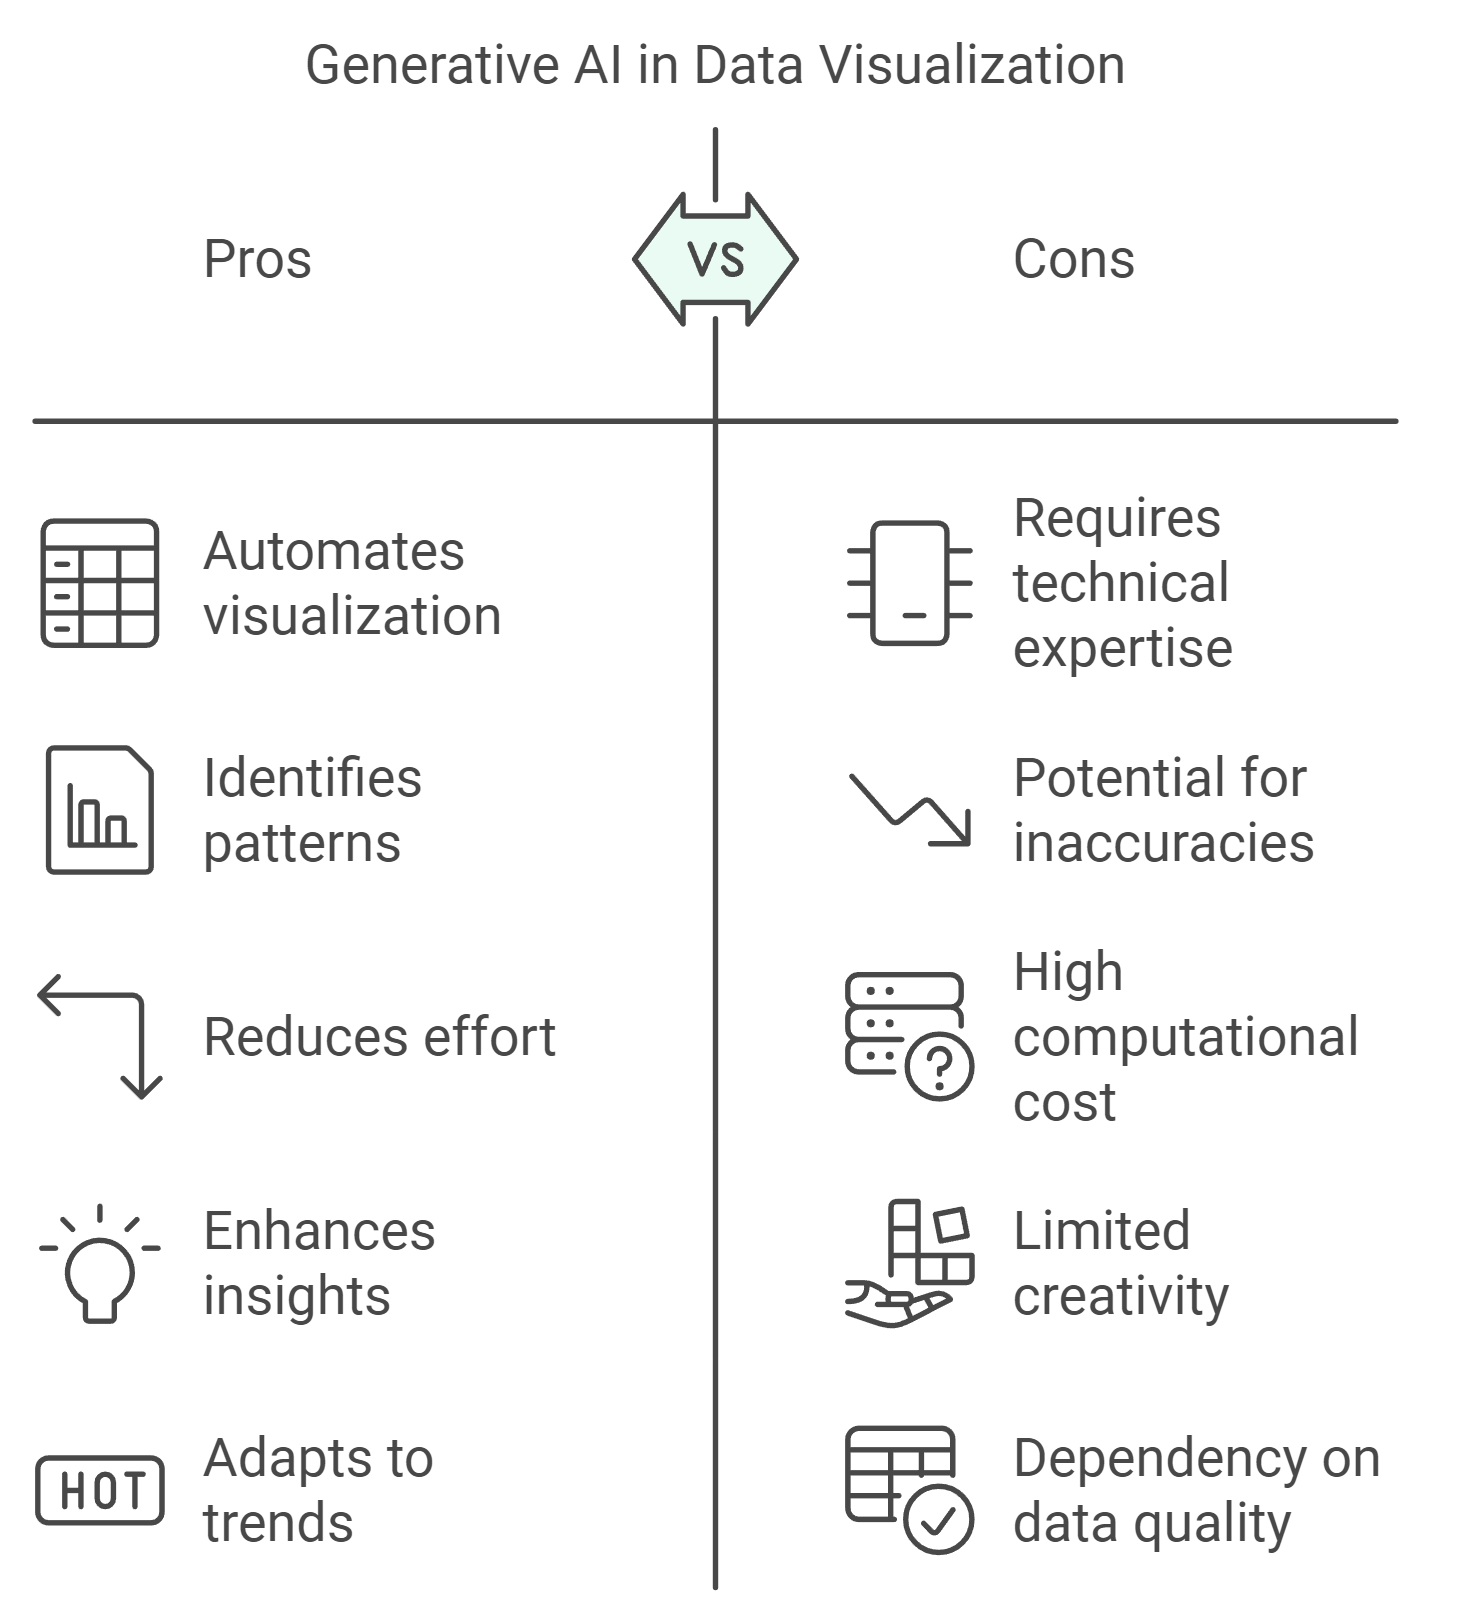
Generative AI refers to a subset of artificial intelligence that creates new content, such as images, text, or even data visualizations, based on patterns it learns from existing datasets. Unlike traditional AI, which focuses on analyzing and interpreting data, generative AI actively produces outputs that mimic human creativity. For example, it can generate charts, graphs, or interactive dashboards by analyzing raw data and identifying the most effective ways to present it. This capability makes it a powerful tool for transforming complex datasets into meaningful visual representations.
Generative AI operates through advanced algorithms like neural networks, which learn from vast amounts of data. These algorithms identify trends, correlations, and anomalies, enabling the creation of visuals that highlight critical insights. By automating this process, generative AI reduces the time and effort required to produce high-quality data visualizations, making it accessible even to those without extensive technical expertise.
Key Techniques in Generative AI for Data Visualization
Generative AI employs several techniques to enhance data visualization. These methods ensure that the visuals are not only accurate but also engaging and easy to interpret:
Neural Networks: These algorithms analyze large datasets to uncover patterns and relationships. For instance, in healthcare, generative AI uses neural networks to create detailed visualizations of patient imaging data, aiding in early disease detection.
Natural Language Processing (NLP): NLP enables generative AI to interpret textual data and convert it into visual formats. This technique is particularly useful for generating summaries or annotations alongside visualizations, making the data more comprehensible.
Reinforcement Learning: This method allows generative AI to improve its outputs over time by learning from user feedback. For example, in financial services, reinforcement learning helps create real-time visualizations of market trends, enhancing decision-making for analysts.
Generative Adversarial Networks (GANs): GANs are used to produce highly realistic visuals by training two neural networks to compete against each other. This technique is often applied in creating interactive and dynamic web-based visualizations, such as those developed using D3.js.
These techniques enable generative AI to handle diverse datasets and produce tailored visualizations that cater to specific needs, whether in retail, urban planning, or environmental science.
The Role of Generative AI in Crafting Insights
Generative AI plays a pivotal role in crafting insights by transforming raw data into actionable knowledge. It automates the process of identifying hidden patterns and trends, which might otherwise go unnoticed. For instance, in retail, generative AI creates visual maps of consumer behavior, helping businesses design targeted marketing campaigns and improve product offerings.
In urban planning, generative AI simulates future growth scenarios and visualizes infrastructure requirements. This helps planners make informed decisions for sustainable development. Similarly, in environmental science, it models climate change impacts, providing policymakers with clear visuals to guide mitigation strategies.
By integrating with tools like Tableau and Power BI, generative AI enhances the storytelling aspect of data visualization. It adapts to evolving data trends, ensuring that the visuals remain relevant and insightful. This adaptability allows you to focus on interpreting the insights rather than spending time on manual adjustments.
Generative AI not only simplifies the visualization process but also ensures that the resulting visuals effectively communicate the underlying data. Whether you're analyzing financial markets, studying urban growth, or exploring consumer preferences, generative AI empowers you to derive meaningful insights and make data-driven decisions.
Benefits of Generative AI in Data Visualization
Enhancing Accuracy and Reducing Errors
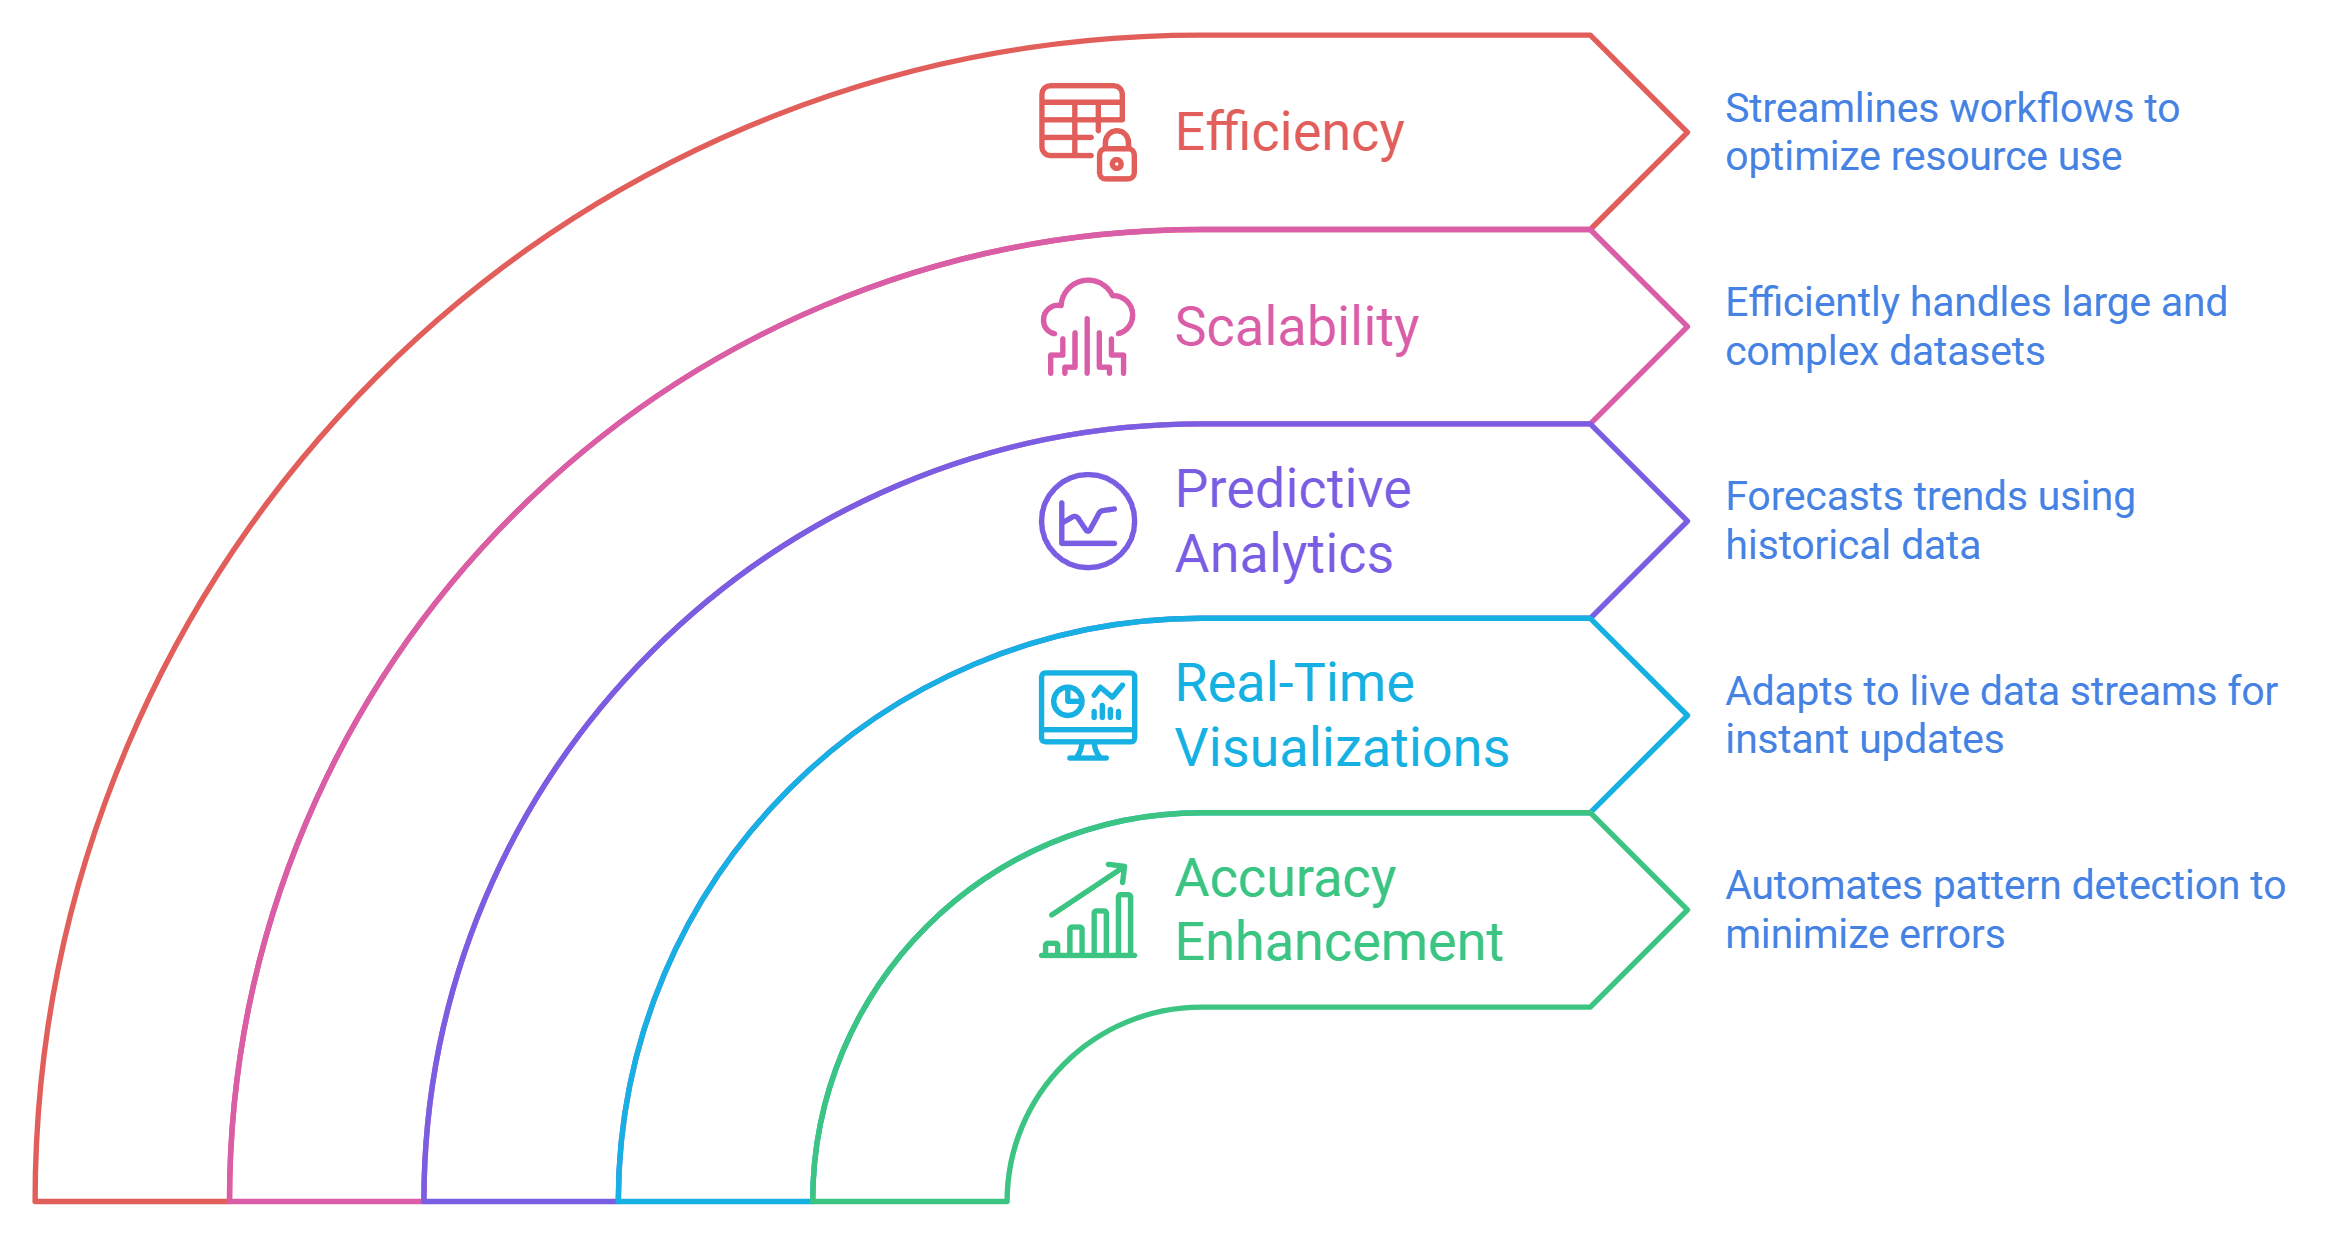
Generative AI enhances the accuracy of data visualization by automating the process of identifying patterns and anomalies. Traditional methods often rely on manual efforts, which can lead to errors or missed details. With generative AI, you can refine your data visualizations to ensure precision. For example, neural networks analyze vast datasets to detect inconsistencies or outliers that might otherwise go unnoticed. This capability minimizes human error and ensures that your visualizations represent the data accurately.
By automating repetitive tasks, generative AI allows you to focus on interpreting insights rather than worrying about potential mistakes. It also adapts to evolving datasets, ensuring that your visualizations remain relevant and error-free. Whether you're working with financial reports or healthcare data, generative AI provides a reliable foundation for creating accurate and impactful visuals.
Real-Time Visualizations and Predictive Analytics
Generative AI empowers you to create real-time visualizations that adapt to live data streams. This feature is particularly valuable in industries like finance, where market trends change rapidly. By integrating generative AI into your workflow, you can monitor dynamic data and make informed decisions instantly. For instance, AI-driven tools can generate real-time data visualization charts that update automatically as new information becomes available.
In addition to real-time capabilities, generative AI excels in predictive analytics. It analyzes historical data to forecast future trends, enabling proactive decision-making. For example, in retail, generative AI can predict customer behavior and visualize these predictions, helping you optimize inventory and marketing strategies. This combination of real-time updates and predictive insights ensures that your data analysis remains both timely and forward-looking.
Scalability and Efficiency in Handling Large Datasets
Handling large datasets can be challenging, but generative AI simplifies this process by automating data visualization workflows. Traditional methods often struggle with scalability, especially when dealing with complex or unstructured data. Generative AI, however, processes vast amounts of information efficiently, making it accessible to users across various skill levels.
Generative AI also supports dynamic visualizations, which adapt to the size and complexity of your data. For example, it can create dynamic web visualizations that scale seamlessly as your dataset grows. This scalability ensures that your visualizations remain effective, regardless of the volume of data you’re working with.
Moreover, generative AI optimizes resource efficiency by reducing the time and effort required to produce high-quality visuals. It eliminates the need for manual adjustments, allowing you to focus on deriving actionable insights. Whether you're analyzing environmental data or urban planning metrics, generative AI streamlines the process, making it both efficient and scalable.
Applications of Generative AI in Data Visualization
Industry-Specific Use Cases
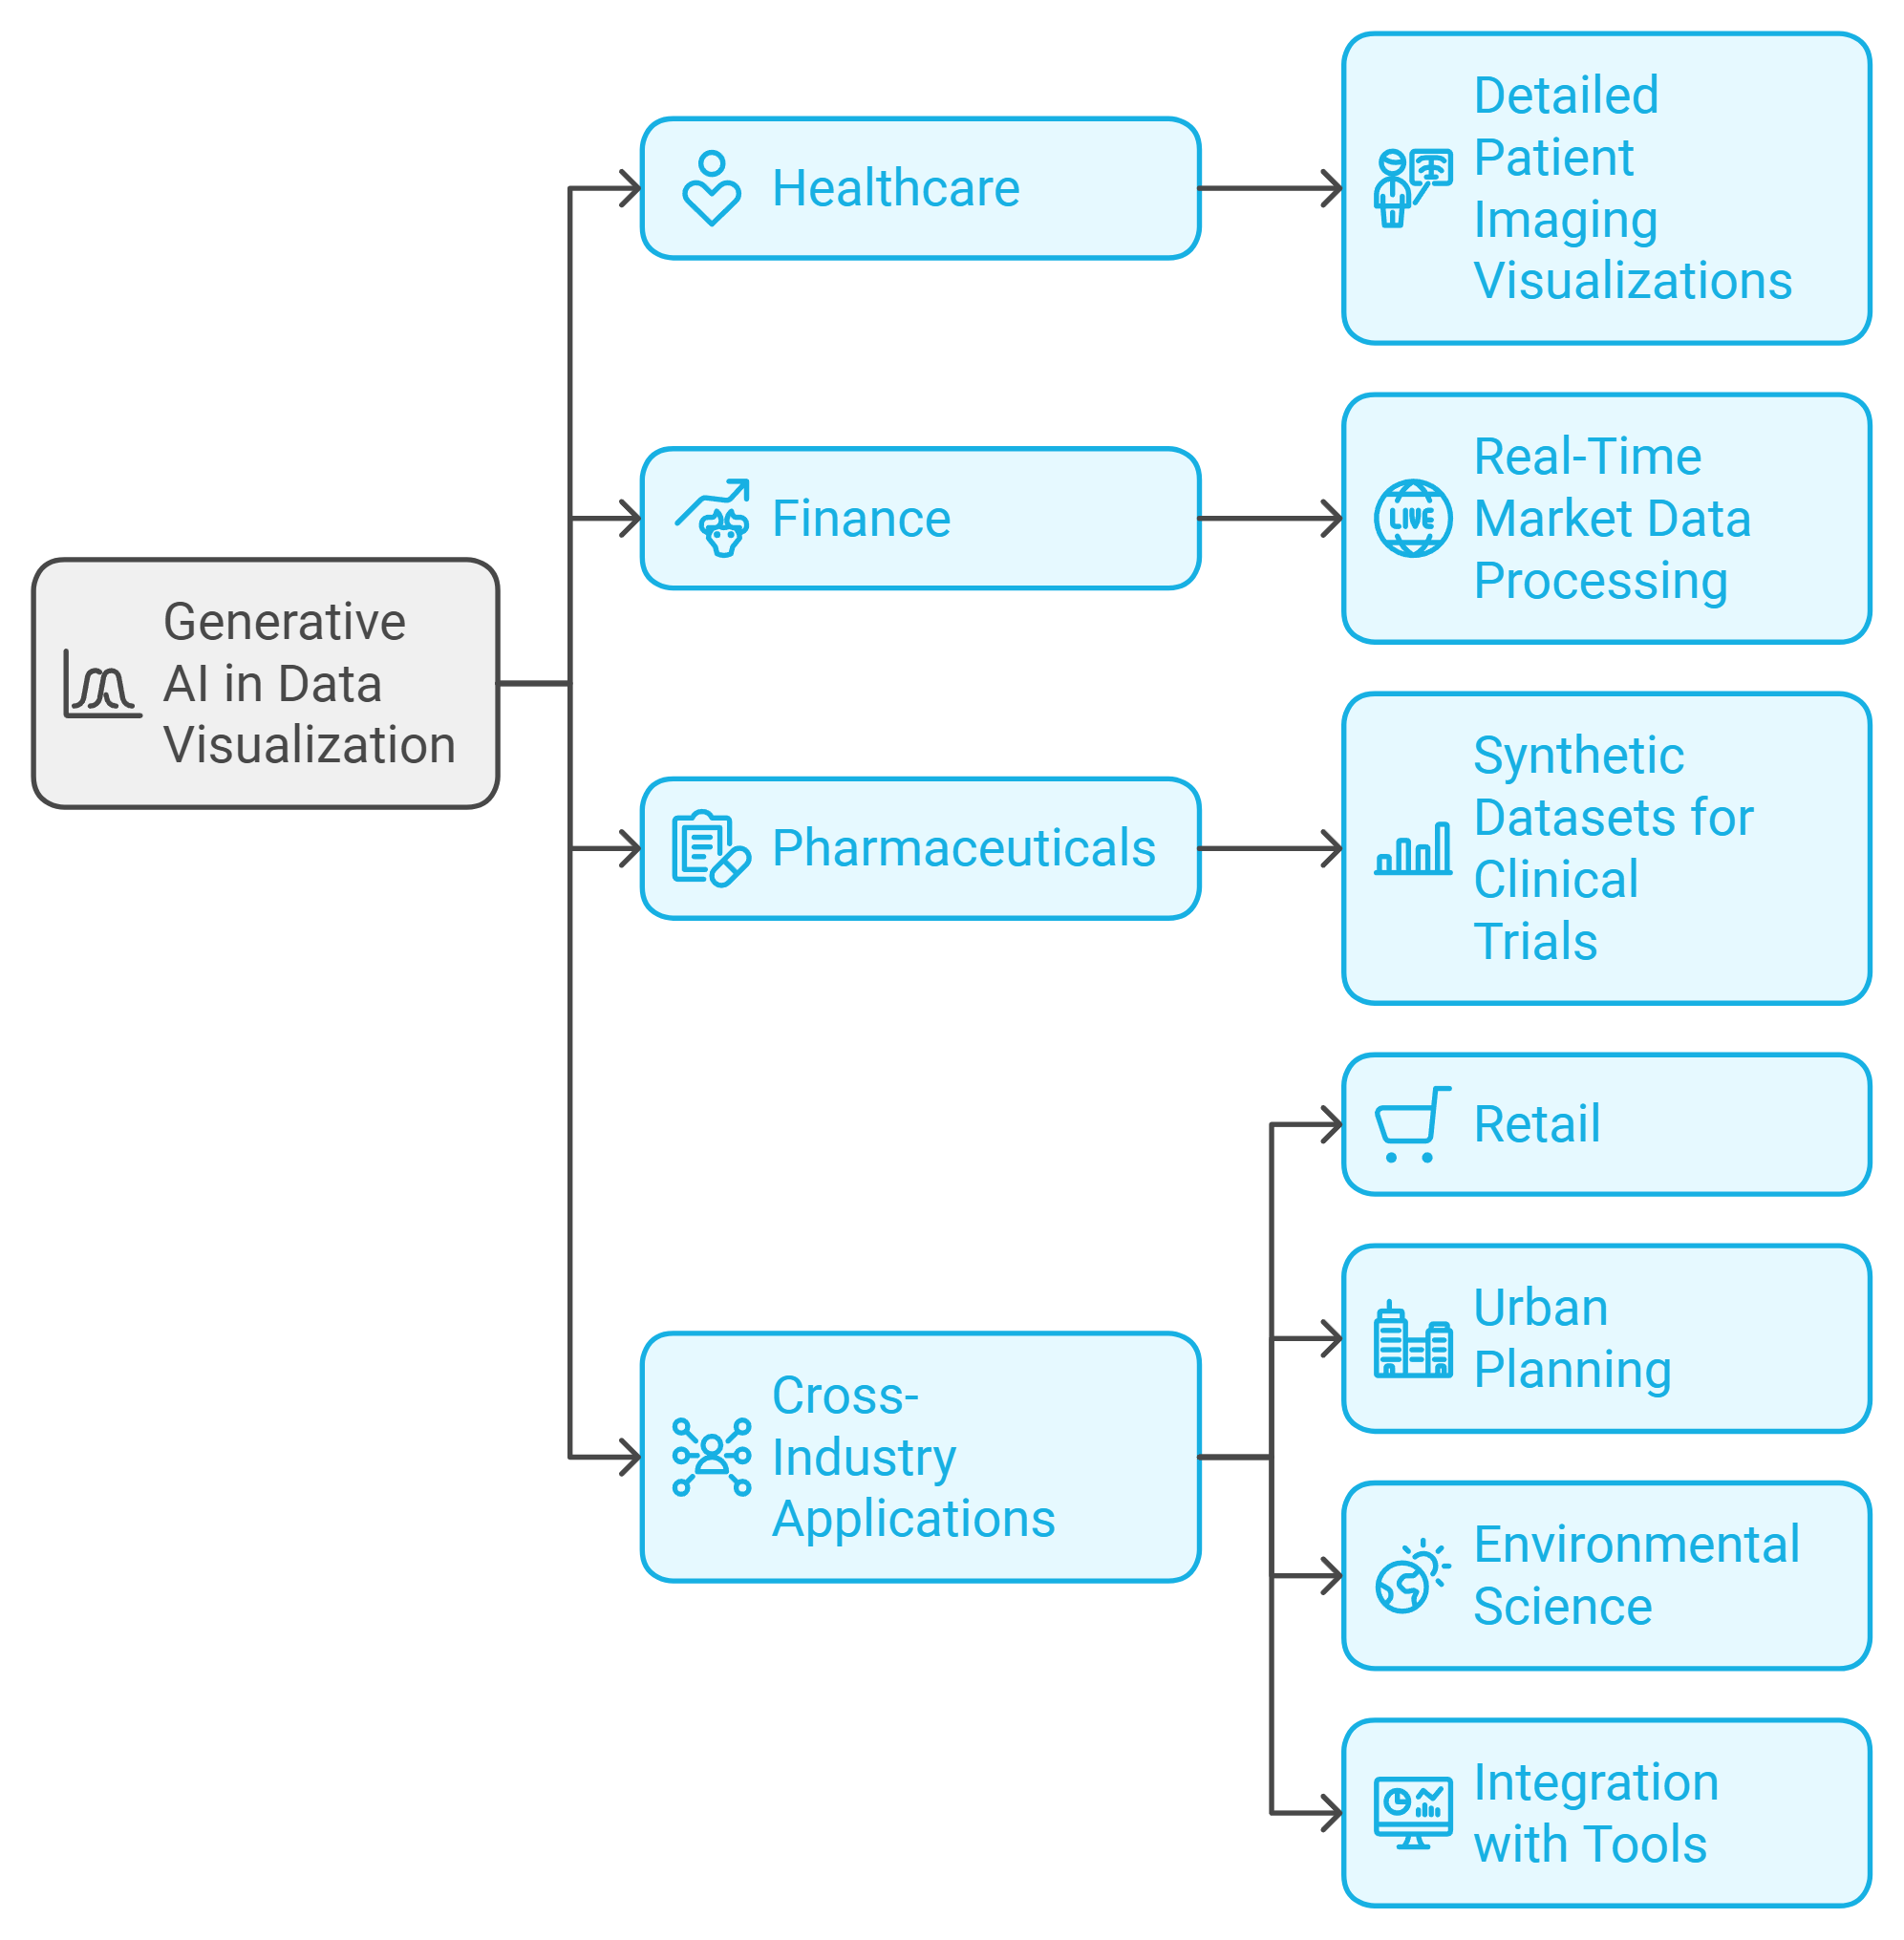
Generative AI has revolutionized how industries approach data visualization, offering tailored solutions to address specific challenges. In healthcare, this technology creates detailed visualizations of patient imaging data. These visuals help doctors identify anomalies with greater precision, significantly improving diagnostic accuracy and patient outcomes. For example, AI-powered tools can transform raw imaging data into dynamic, easy-to-interpret charts, enabling faster and more informed medical decisions.
In the financial sector, generative AI processes vast amounts of market data in real-time. It generates data visualization charts that highlight trends and patterns, enhancing trading strategies and risk management. Financial institutions like JPMorgan Chase have adopted AI-powered tools to clean and organize data, minimizing manual entry errors. This approach results in faster, more reliable reports, empowering analysts to make better decisions under tight deadlines.
The pharmaceutical industry also benefits from generative AI. By creating synthetic datasets, companies can simulate clinical trial scenarios. This capability proves crucial for designing trials that are both efficient and effective. These datasets allow researchers to visualize potential outcomes, reducing risks and accelerating the drug development process.
Cross-Industry Applications for Enhanced Insights
Generative AI extends its impact beyond specific industries, offering cross-industry applications that enhance insights and decision-making. Businesses across sectors use this technology to uncover hidden patterns in their data. For instance, retail companies analyze customer behavior through AI-generated visualizations. These insights help optimize inventory management and design targeted marketing campaigns.
Urban planning professionals rely on generative AI to simulate future growth scenarios. By visualizing infrastructure needs, planners can make data-driven decisions that support sustainable development. Similarly, environmental scientists use AI to model climate change impacts. These models provide policymakers with actionable insights, guiding strategies to mitigate environmental risks.
Generative AI also enhances collaboration by integrating with popular tools like Tableau and Power BI. These integrations allow you to create dynamic visualizations that adapt to evolving data trends. Whether you're analyzing financial markets or studying urban growth, generative AI ensures your visuals remain relevant and insightful.
By applying generative AI across industries, you can transform complex datasets into meaningful visual narratives. This approach not only simplifies data analysis but also empowers you to make informed decisions that drive success.
Real-World Examples of Generative AI in Data Visualization
Case Studies from Healthcare, Finance, and Urban Planning
Generative AI has made a significant impact across industries by transforming how you approach data visualization. In healthcare, it refines patient imaging data into detailed visualizations that improve diagnostic accuracy. For example, AI-powered tools analyze medical scans to detect anomalies, enabling doctors to identify diseases earlier. This precision directly influences patient outcomes, as timely interventions become possible.
In finance, generative AI processes vast amounts of market data to create real-time data visualization charts. These charts highlight trends and patterns, helping analysts make informed decisions. For instance, financial institutions use AI to monitor stock market fluctuations and predict risks. This capability enhances forecasting accuracy and supports better investment strategies.
Urban planning also benefits from generative AI. It simulates future growth scenarios and visualizes infrastructure needs. For example, city planners use AI-generated maps to identify areas requiring new roads or utilities. These visualizations guide sustainable development and ensure resources are allocated efficiently. By integrating generative AI, urban planners can address challenges like population growth and environmental impact with data-driven solutions.
"Generative AI meticulously refines data visualizations by identifying inconsistencies or errors in the data that might otherwise go unnoticed. This is particularly beneficial in fields like healthcare, where accurate data representation can directly influence patient outcomes, or in finance, where precise data interpretation impacts financial forecasting and risk assessment."
Lessons Learned from Successful Implementations
From these case studies, you can draw valuable lessons about leveraging generative AI effectively. First, prioritize data quality. Generative AI relies on clean, structured data to produce accurate visualizations. Inconsistent or incomplete data can lead to misleading insights. For example, healthcare providers ensure patient records are accurate before using AI tools to generate visualizations.
Second, embrace collaboration between AI and human expertise. While generative AI automates visualization processes, human creativity remains essential. You bring context and intuition that AI cannot replicate. For instance, financial analysts interpret AI-generated charts to uncover deeper insights about market behavior.
Third, focus on scalability. Generative AI excels at handling large datasets, but you must ensure your tools can adapt to growing data volumes. Dynamic visualizations, which adjust as data changes, prove especially useful. For example, urban planners use scalable AI tools to update infrastructure maps as new data becomes available.
Finally, consider ethical implications. Addressing bias in AI-generated visualizations ensures fairness and accuracy. For example, healthcare organizations review AI outputs to avoid disparities in patient care. By combining ethical practices with advanced technology, you can maximize the benefits of generative AI while minimizing risks.
How to Leverage Generative AI for Data Visualization
Preparing Your Data for Generative AI
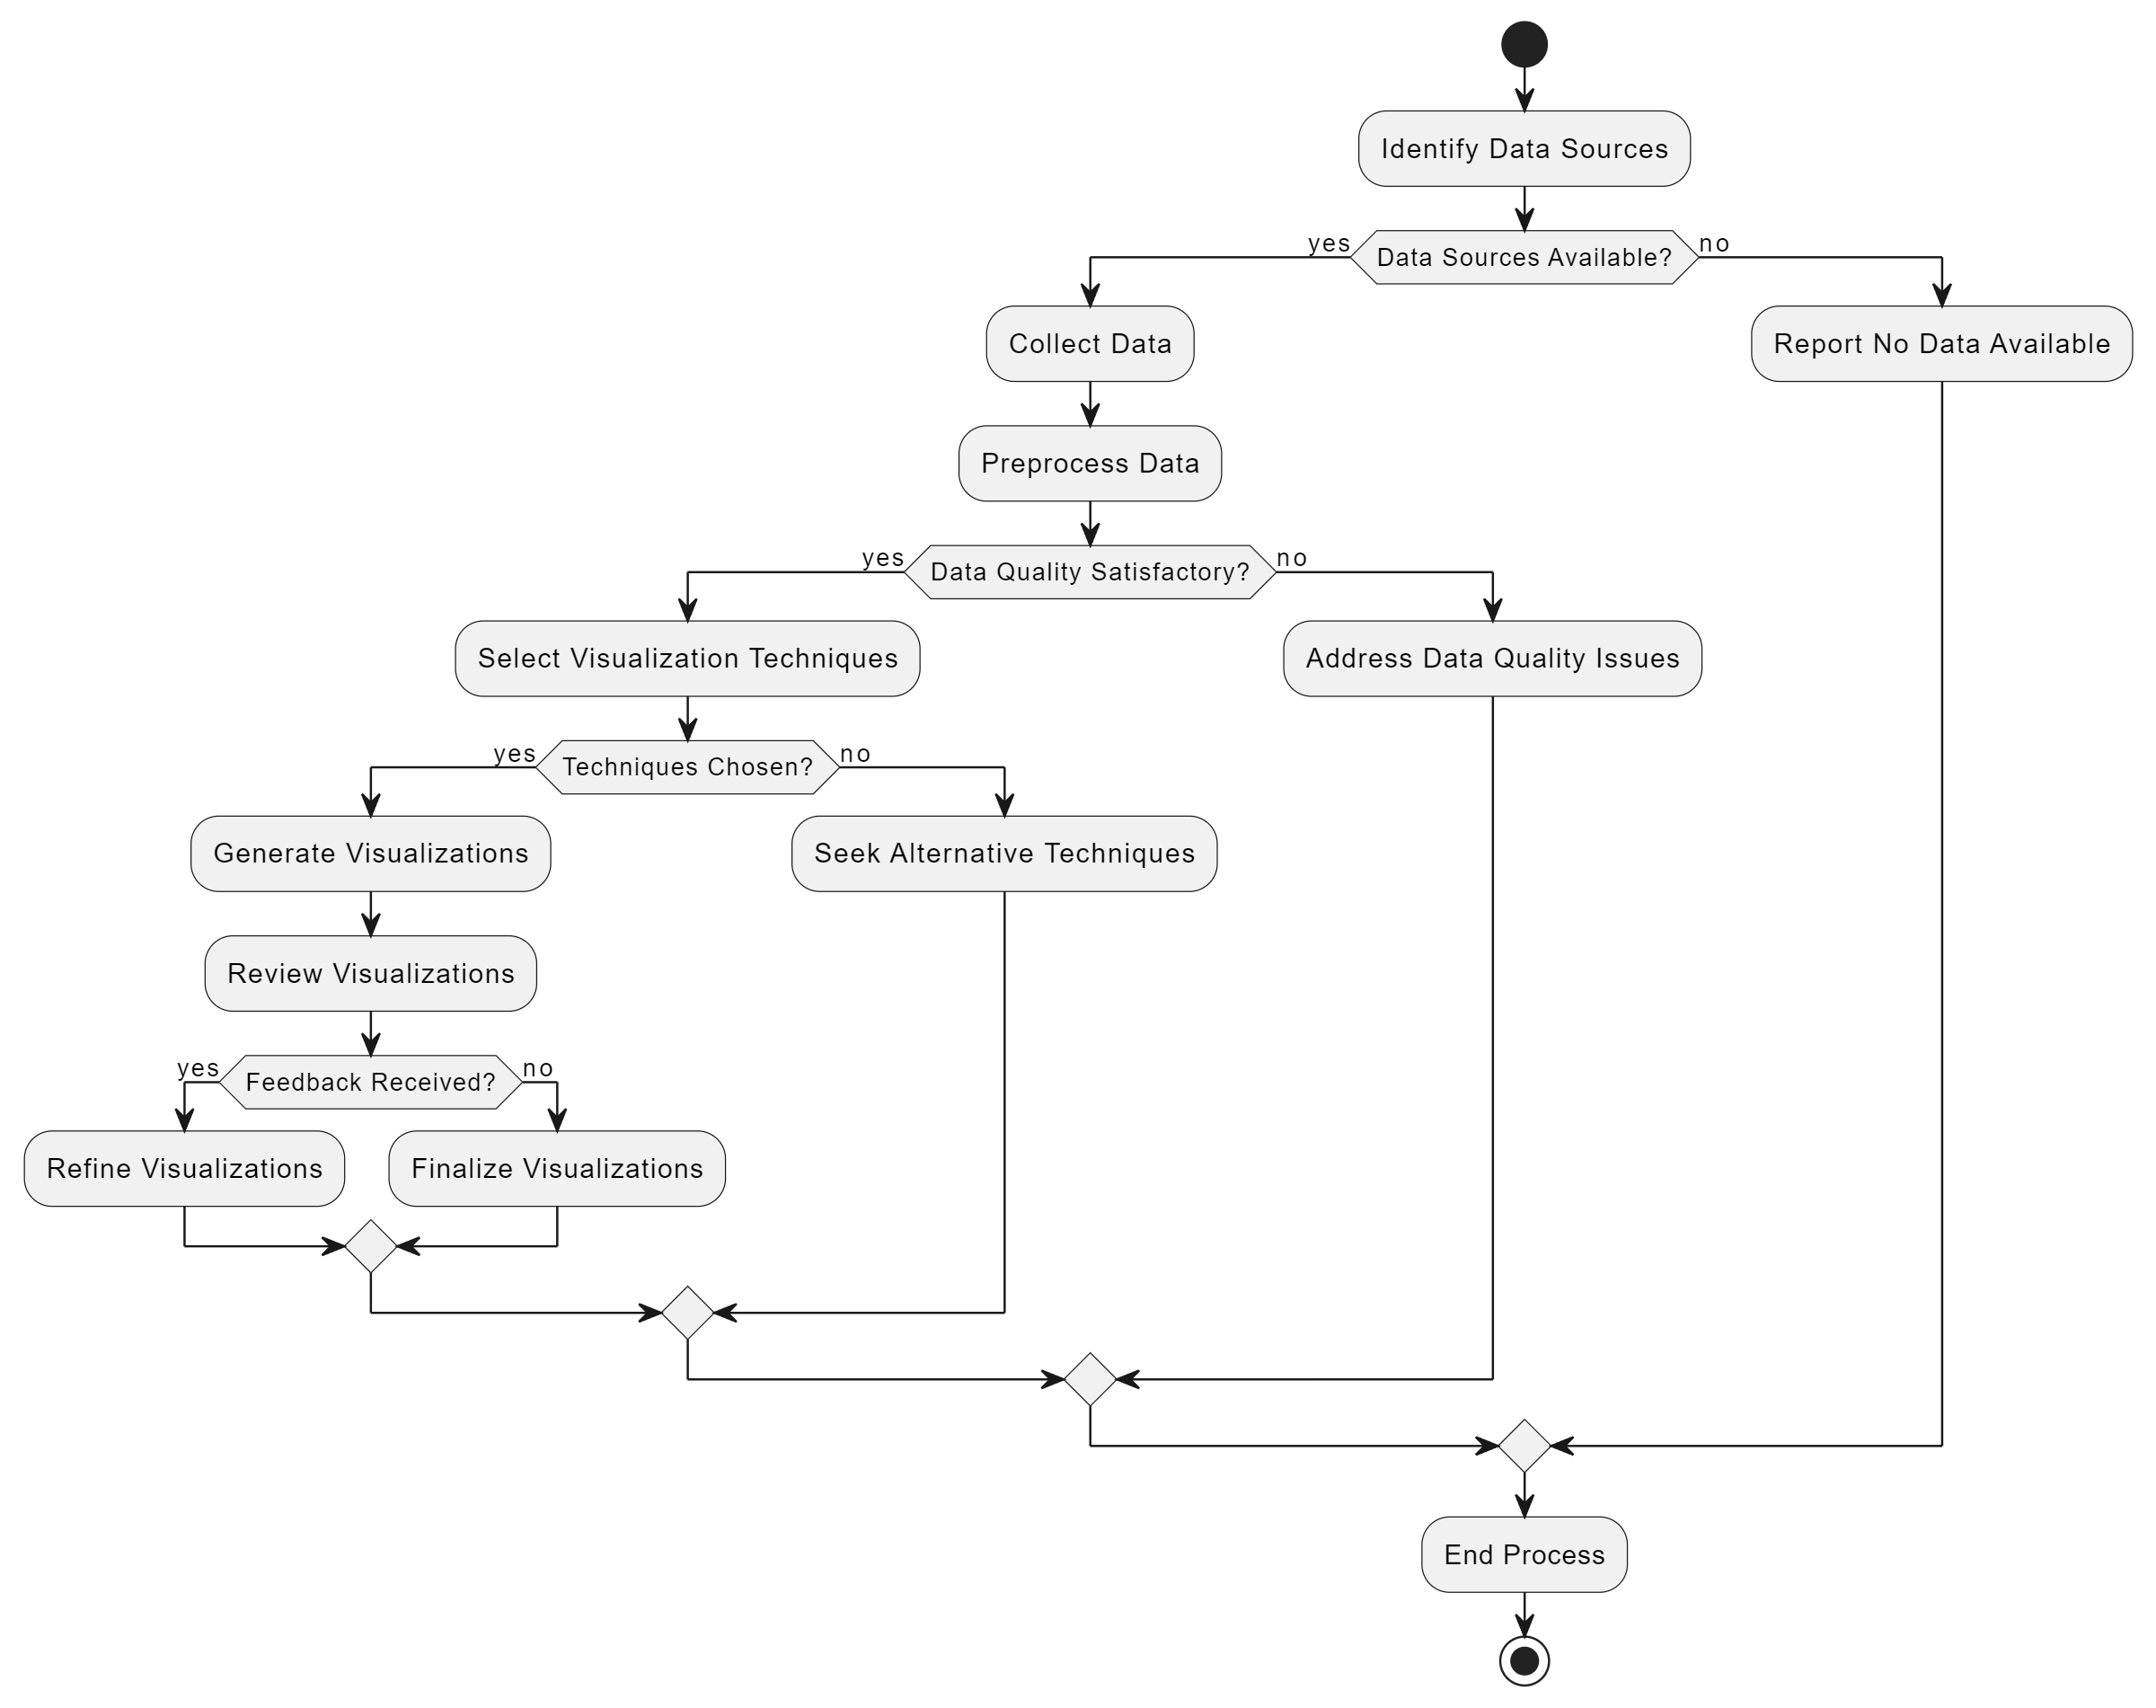
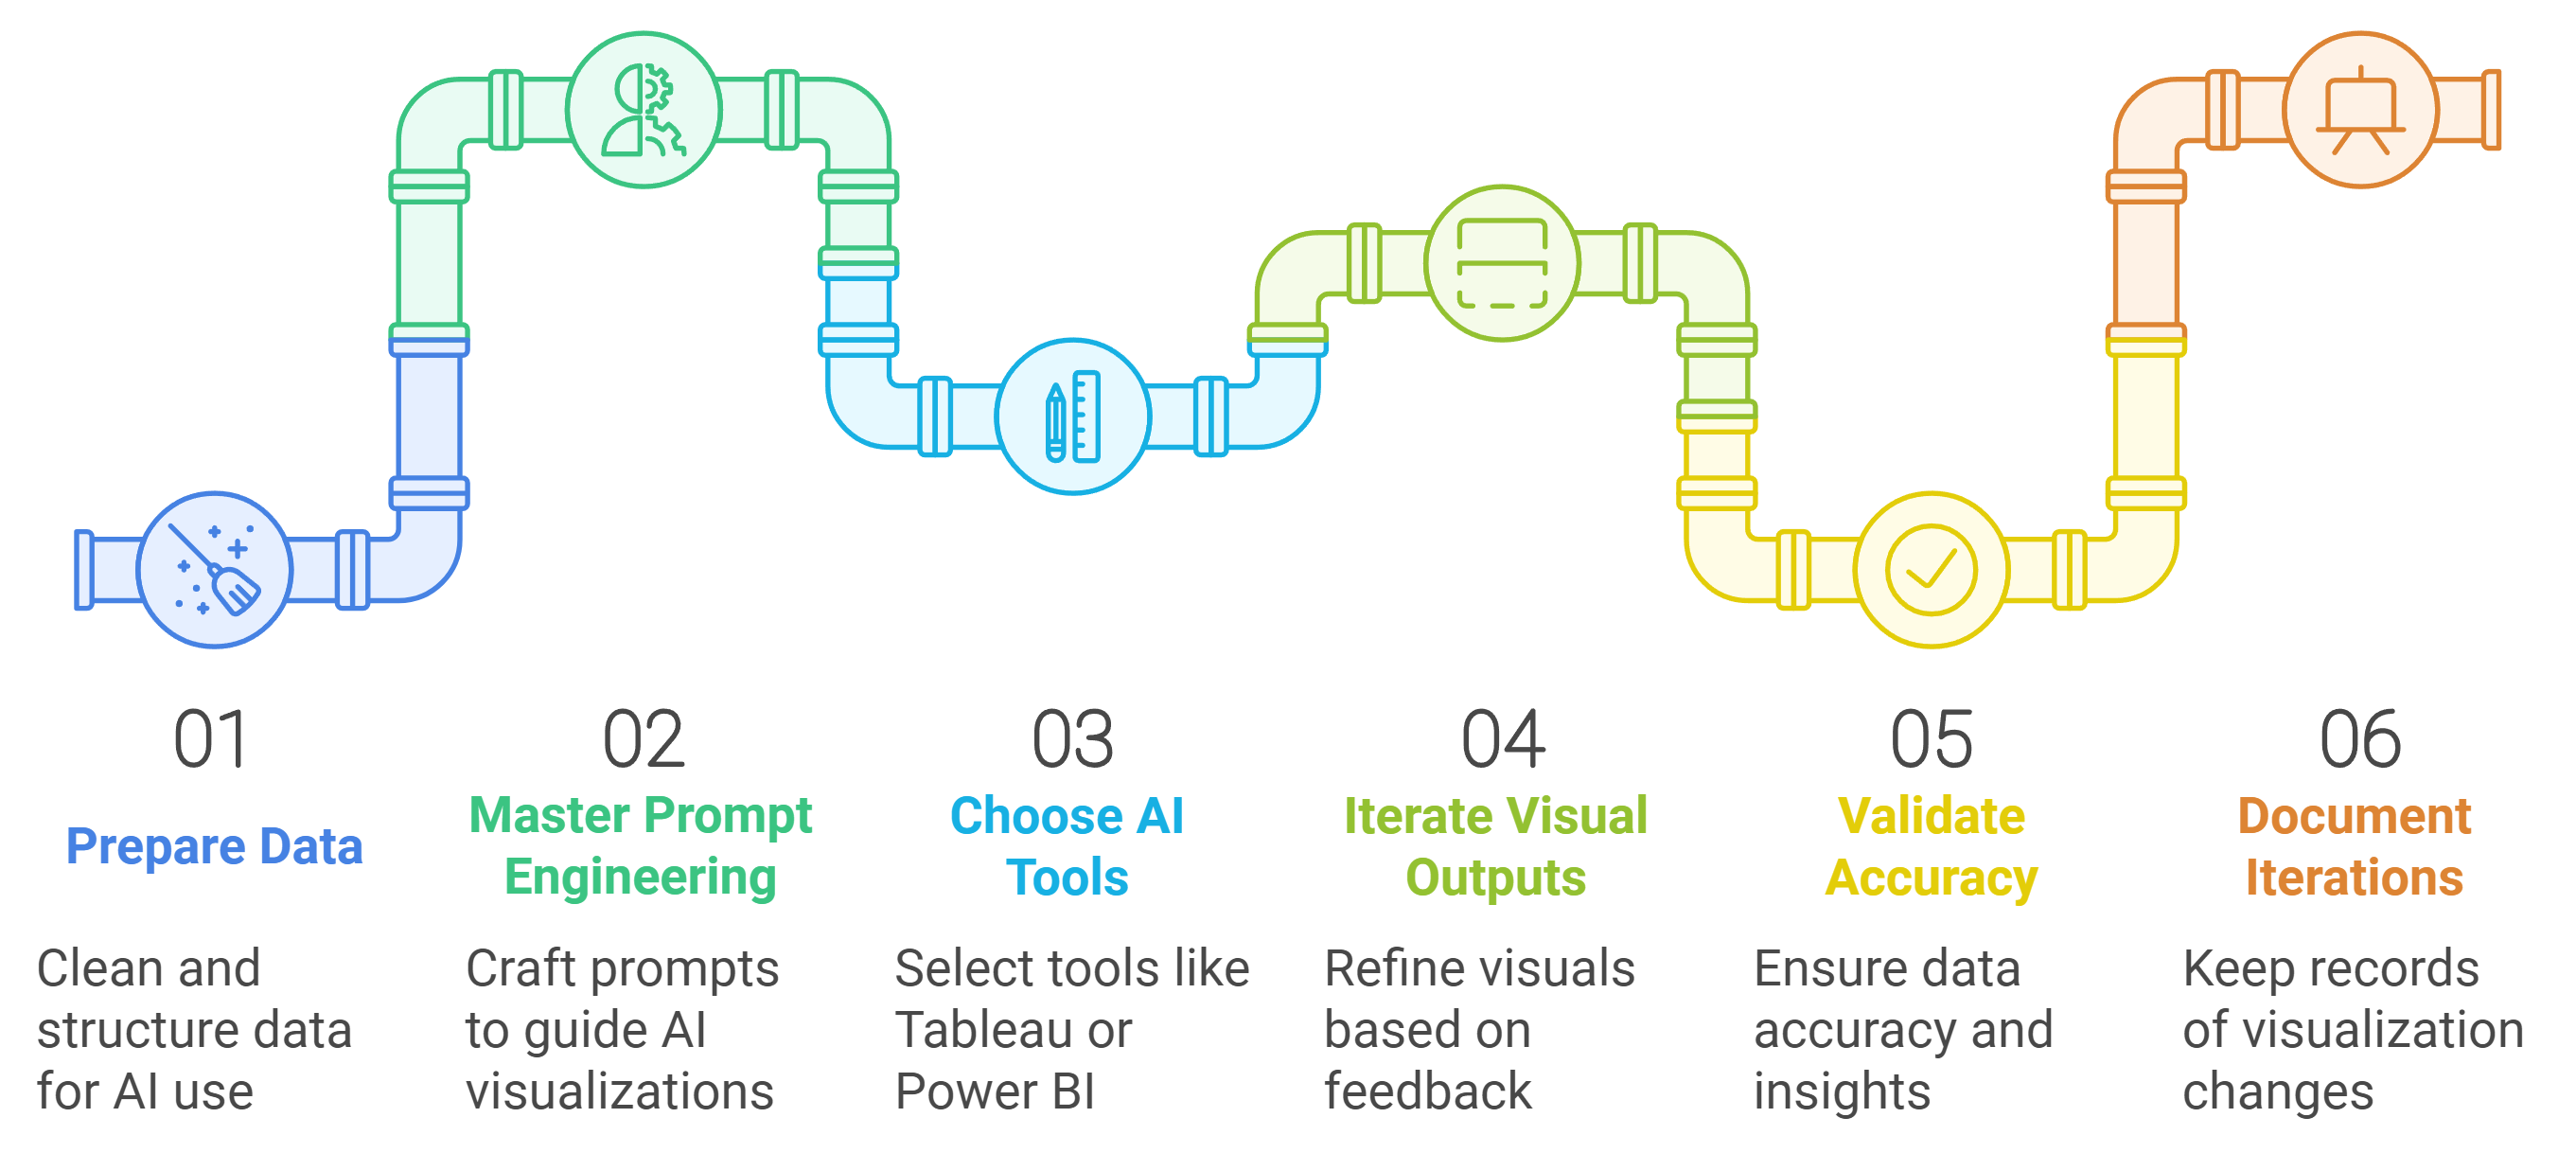
To maximize the potential of generative AI in data visualization, you must start with well-prepared data. Clean and structured data ensures accurate and meaningful outputs. Begin by identifying the specific datasets you want to visualize. Remove duplicates, fill in missing values, and standardize formats to maintain consistency. For example, if you're working with sales data, ensure all dates follow the same format and product categories are labeled uniformly.
Organize your data into logical groupings. This step simplifies the process for AI tools to analyze and extract insights. Use tools like Microsoft Excel or Python libraries such as Pandas to preprocess your data efficiently. Additionally, consider the audience for your visualizations. Tailor your data preparation to highlight the most relevant metrics or trends for them.
Finally, validate your data. Double-check for errors or inconsistencies that could distort the visualizations. Generative AI relies on accurate inputs to produce reliable outputs. By investing time in data preparation, you set the foundation for impactful and error-free visualizations.
Mastering Prompt Engineering for Better Visualizations
Prompt engineering plays a crucial role in guiding generative AI to create effective visualizations. A well-crafted prompt provides clear instructions, ensuring the AI understands your goals. Start by defining the type of visualization you need. For instance, specify whether you want a bar chart, heatmap, or interactive dashboard.
Include key details in your prompt. Mention the data points to focus on, the relationships to highlight, and the desired level of detail. For example, if you're analyzing customer behavior, your prompt might request a visualization showing purchase trends over time segmented by age group.
Experiment with different prompts to refine the outputs. Generative AI improves with iterative feedback. If the initial visualization doesn't meet your expectations, adjust the prompt to clarify your requirements. Tools like Tableau and Power BI, integrated with generative AI capabilities, allow you to interact with the AI through conversational prompts. This feature simplifies the process of refining your visualizations.
By mastering prompt engineering, you gain greater control over the visualization process. Clear and precise prompts lead to visuals that effectively communicate your data insights.
Choosing the Right Generative AI Tools
Selecting the right tools is essential for leveraging generative AI in data visualization. Evaluate tools based on their compatibility with your existing workflows and the complexity of your data. Popular options like Tableau and Microsoft Power BI offer robust AI integrations. These tools automate visualization creation and adapt to evolving data trends in real-time.
Consider the specific features of each tool. For example, Tableau's AI plugins analyze incoming data and adjust visual parameters automatically. This capability ensures your visualizations remain accurate and relevant without manual intervention. Similarly, Power BI uses AI to uncover hidden insights and present them interactively, making it easier for you to act on the findings.
Scalability is another factor to assess. Choose tools that can handle large datasets efficiently. Generative AI tools with dynamic visualization capabilities allow you to scale your visual outputs as your data grows. Additionally, prioritize tools with user-friendly interfaces. Intuitive designs make it easier for you to navigate the features and create impactful visualizations.
By selecting the right generative AI tools, you streamline your data analysis process and enhance the quality of your visualizations. These tools empower you to uncover insights quickly and present them effectively to your audience.
Iterating and Refining Visual Outputs
Refining visual outputs is a critical step in creating impactful data visualizations. Generative AI allows you to iterate on your visuals efficiently, ensuring they align with your goals and resonate with your audience. By leveraging its capabilities, you can enhance clarity, accuracy, and relevance in your visualizations.
1. Analyze Initial Outputs
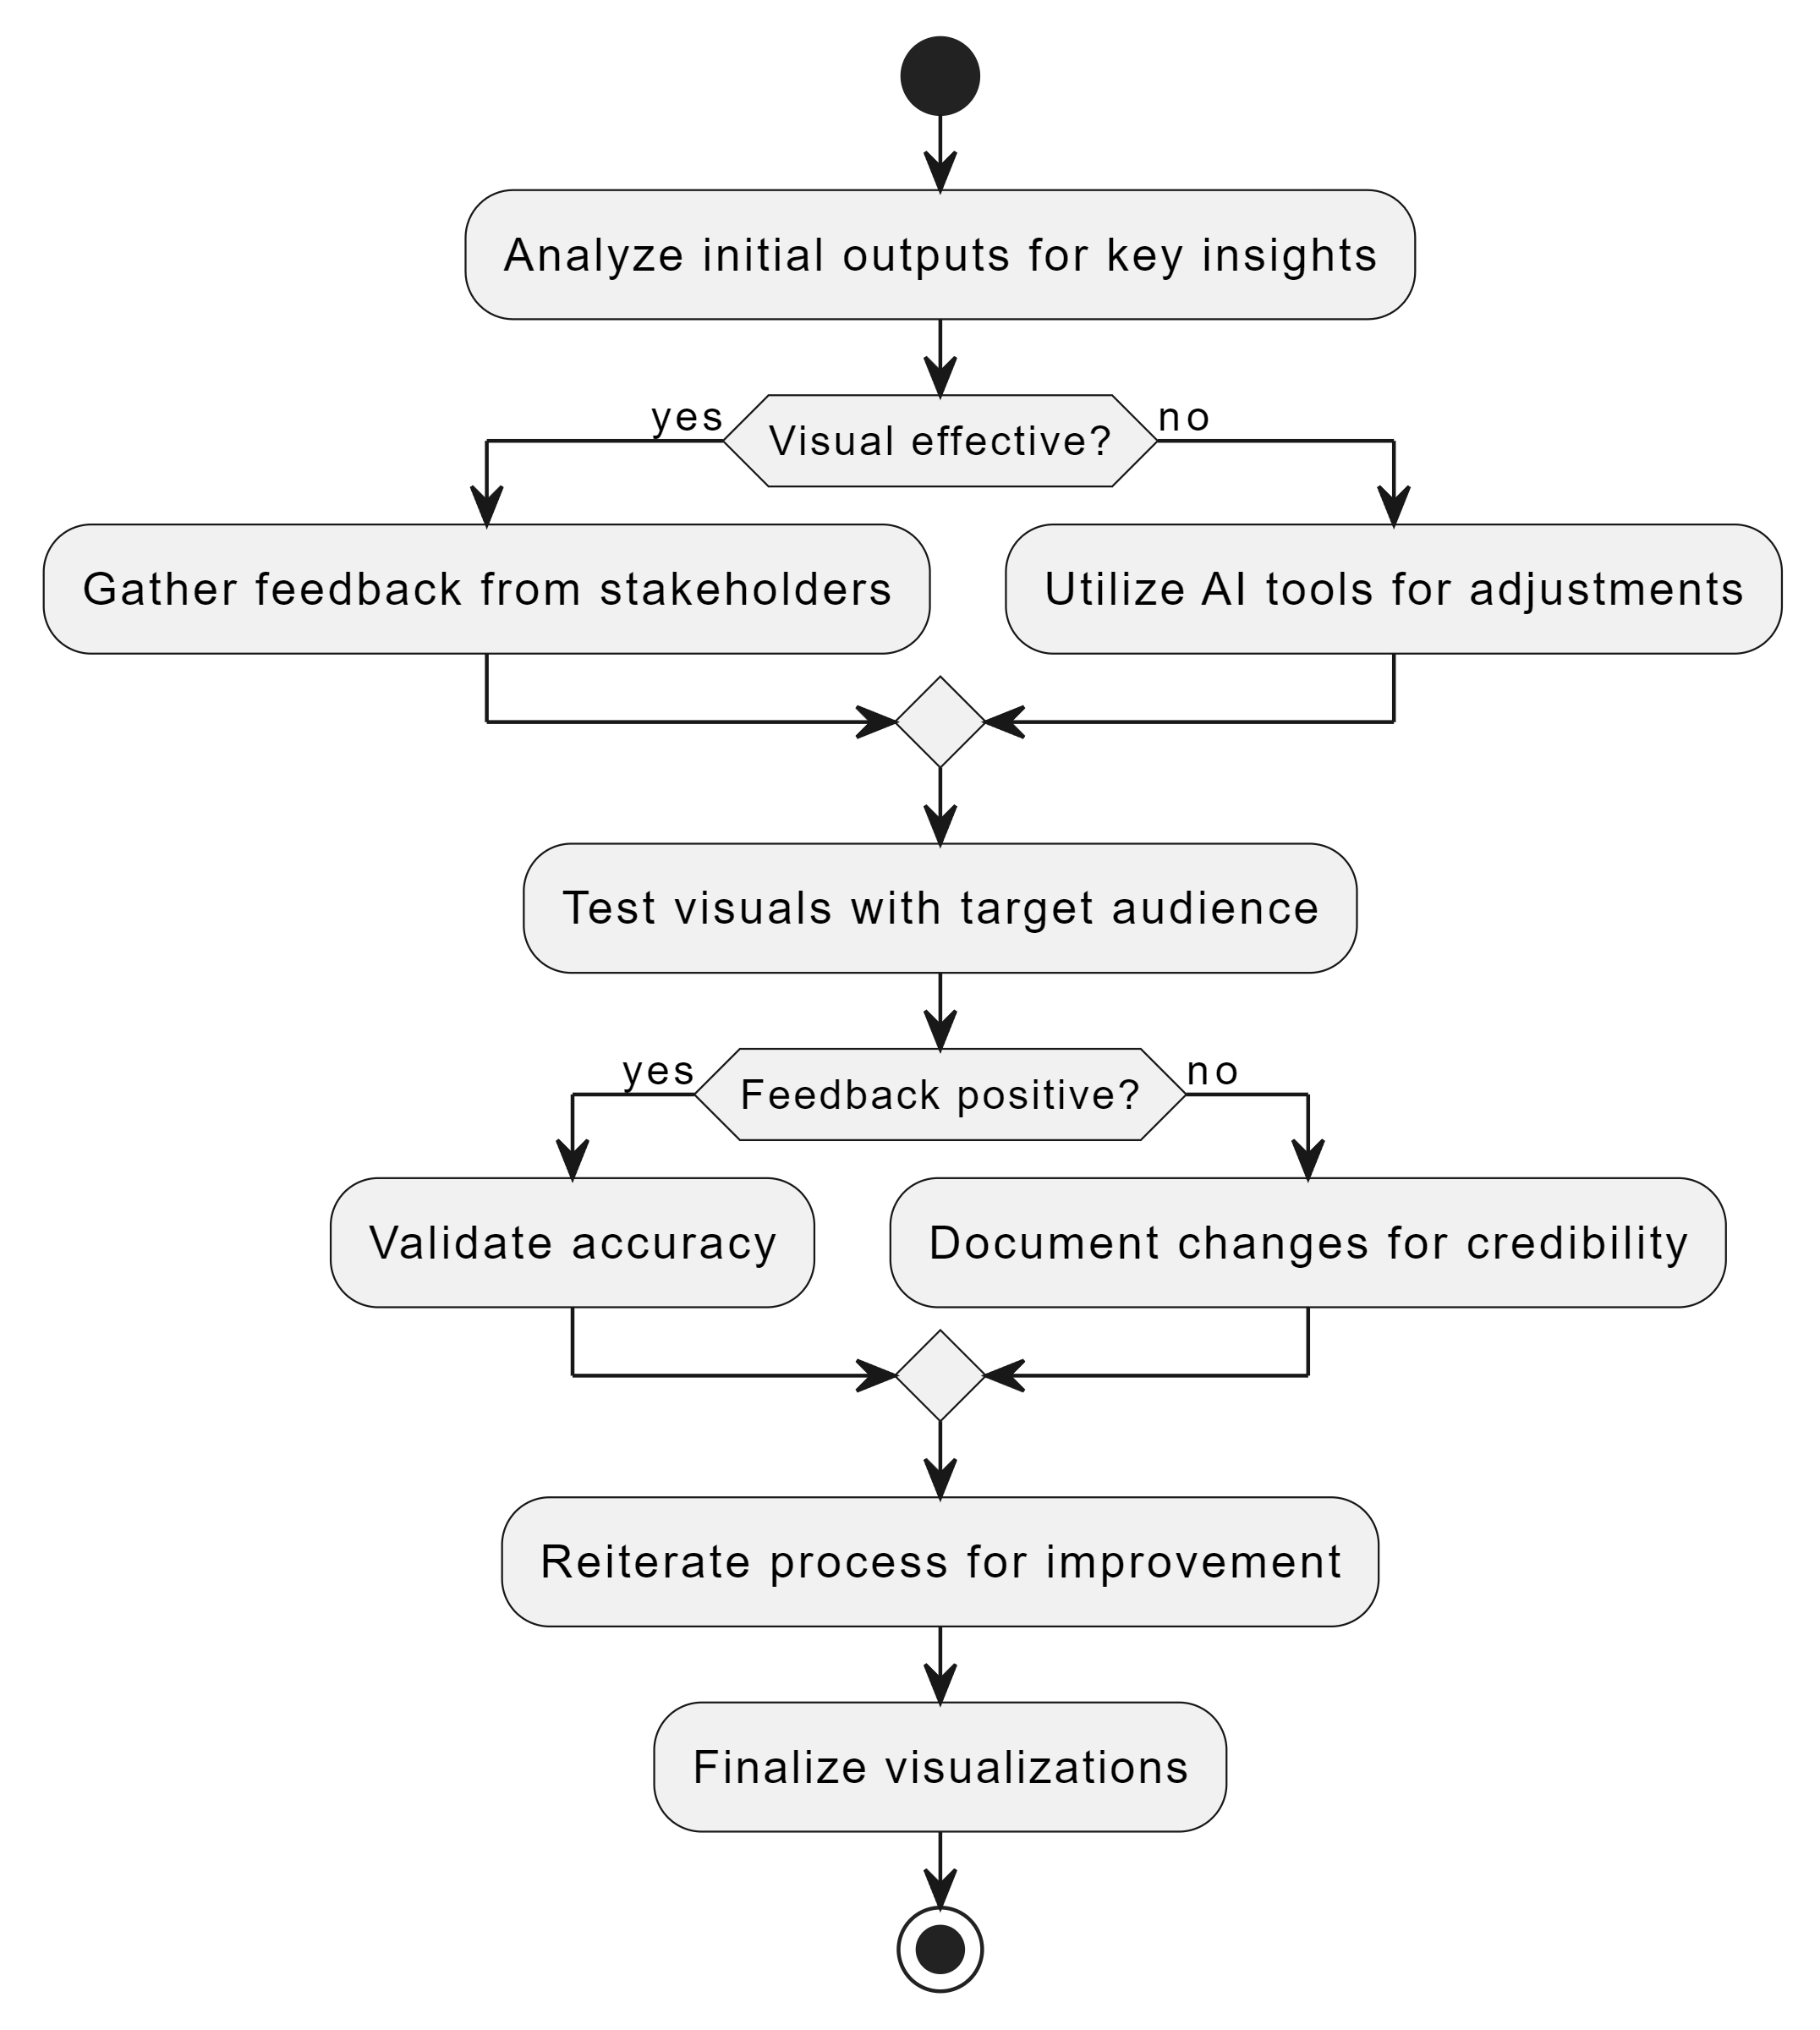
Start by reviewing the initial visualizations generated by the AI. Focus on whether the visuals effectively communicate the key insights. Check for elements like color schemes, chart types, and data labels. For example, if you're using Tableau with generative AI plugins, the tool can automatically adjust visual parameters based on real-time data analysis. This ensures that your visuals remain accurate and up-to-date.
"Generative AI tools like Tableau's AI plugins analyze incoming data and refine visual parameters automatically, saving time and improving accuracy."
2. Gather Feedback
Feedback plays a vital role in refining your outputs. Share the initial visualizations with stakeholders or team members to gather their perspectives. Ask specific questions about the clarity and relevance of the visuals. For instance, does the chart highlight the most critical trends? Are the insights easy to interpret? Use this feedback to identify areas for improvement.
3. Make Iterative Adjustments
Use the feedback to make targeted adjustments to your visualizations. Generative AI excels at iterative refinement. Tools like Microsoft Power BI allow you to interact with the AI through conversational prompts, enabling you to tweak visuals in real-time. For example, you can request changes to chart types, add annotations, or highlight specific data points. This iterative process ensures that the final output meets your expectations.
"Microsoft Power BI integrates AI capabilities to uncover hidden insights and present them interactively, making it easier to refine visualizations based on user input."
4. Test for Audience Relevance
After refining the visuals, test them with your target audience. Ensure that the visualizations address their needs and preferences. Generative AI can help tailor outputs for specific audiences by identifying the most relevant data points. For example, in a business context, AI tools can generate visuals that focus on metrics important to decision-makers, such as sales trends or customer behavior.
5. Validate Accuracy and Insights
Before finalizing your visualizations, validate their accuracy. Cross-check the data and ensure that the visuals align with the underlying information. Generative AI tools, such as those integrated into business intelligence platforms, can assist by analyzing the data for inconsistencies or errors. This step is crucial for maintaining credibility and trust in your visualizations.
6. Save and Document Iterations
Document each iteration of your visualizations. This practice helps you track changes and understand the evolution of your outputs. Many generative AI tools offer version control features, allowing you to save different iterations and revert to previous versions if needed. This ensures that you have a clear record of the refinement process.
By iterating and refining your visual outputs, you can create data visualizations that are not only visually appealing but also highly effective in communicating insights. Generative AI streamlines this process, enabling you to focus on delivering value to your audience.
Integrating Generative AI with Popular Data Visualization Tools
Generative AI has revolutionized how you approach data visualization by seamlessly integrating with widely-used tools. These integrations simplify workflows, enhance insights, and make complex datasets more accessible. By leveraging these tools, you can unlock the full potential of your data and create impactful visual narratives.
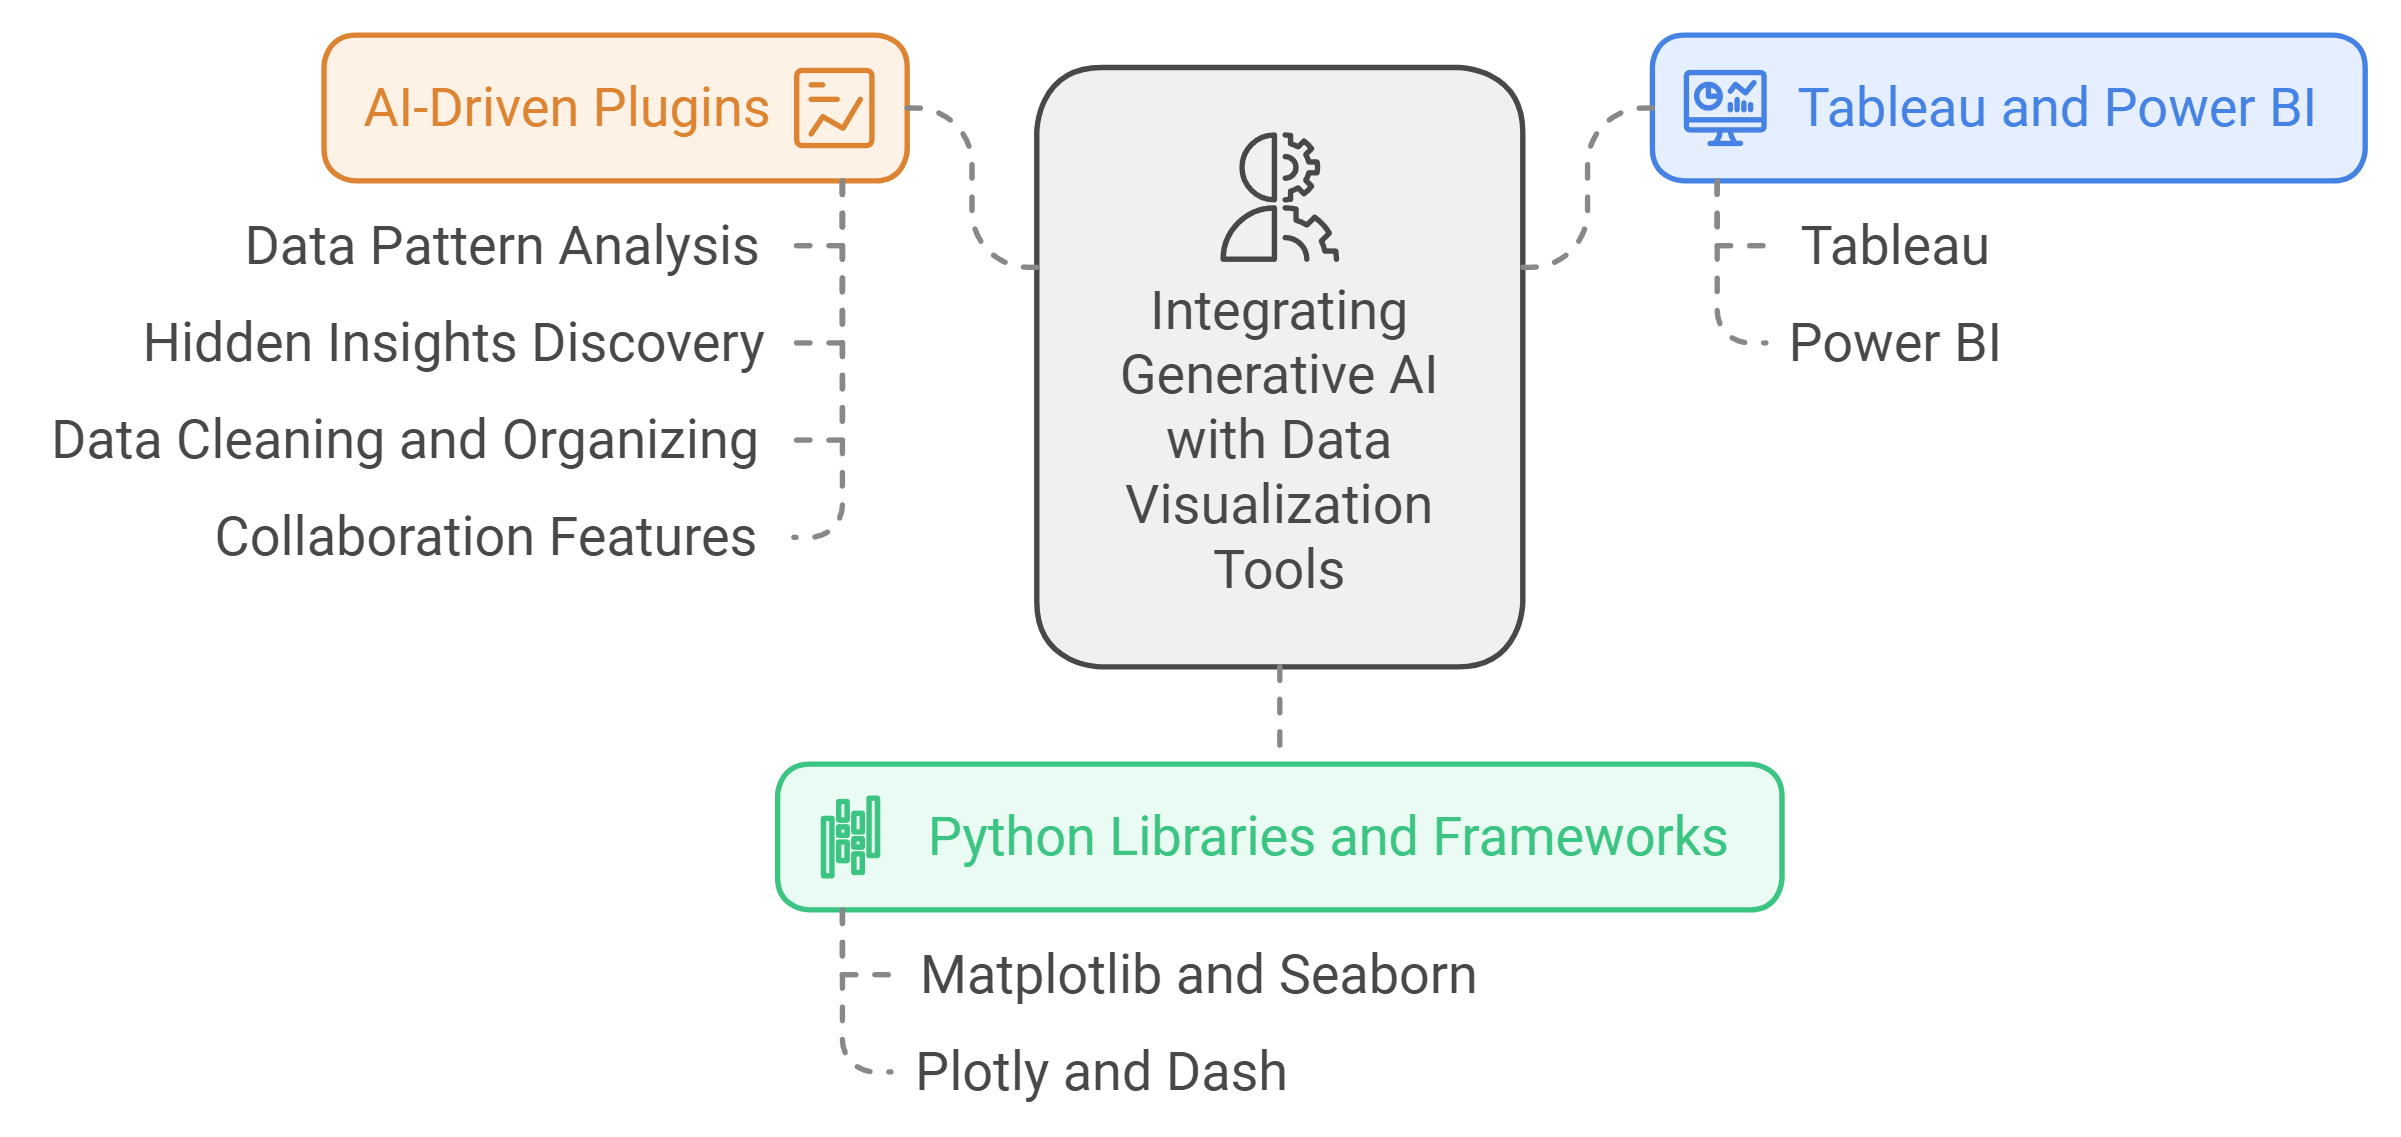
Tableau and Power BI Integrations
Tableau and Power BI are two of the most popular platforms for data visualization. Both tools now offer advanced integrations with generative AI, enabling you to automate processes and uncover deeper insights. These integrations allow you to transform raw data into dynamic visuals with minimal effort.
In Tableau, AI-driven plugins analyze incoming data and recommend the best visualization types. For example, if you’re working with sales data, Tableau can suggest heatmaps or bar charts to highlight trends effectively. You can also use conversational prompts to refine your visuals. This feature ensures that your outputs align with your goals without requiring extensive technical expertise.
Power BI takes a similar approach by embedding AI capabilities directly into its platform. It enables you to generate real-time visualizations that adapt to live data streams. For instance, you can monitor financial metrics as they update, ensuring your decisions are always based on the latest information. Power BI also excels in predictive analytics, helping you forecast trends and visualize future scenarios.
Both tools prioritize user-friendly interfaces, making it easy for you to interact with generative AI features. Whether you’re a beginner or an experienced analyst, these integrations streamline your workflow and enhance the quality of your visualizations.
Python Libraries and Open-Source Frameworks
Python has become a cornerstone for data analysis and visualization, thanks to its extensive libraries and frameworks. Generative AI integrates seamlessly with Python tools, offering you unparalleled flexibility and control over your data.
Libraries like Matplotlib and Seaborn provide robust options for creating static and interactive visualizations. By incorporating generative AI, these libraries can automate the design process, saving you time and effort. For example, AI algorithms can analyze your dataset and suggest the most effective chart types, ensuring clarity and impact.
Open-source frameworks like Plotly and Dash take this a step further by enabling dynamic, web-based visualizations. Generative AI enhances these frameworks by generating interactive dashboards that adapt to user inputs. This capability proves invaluable when presenting data to diverse audiences, as it allows you to tailor the visuals in real-time.
Python’s integration with generative AI also supports advanced techniques like natural language processing and machine learning. These features enable you to extract deeper insights from unstructured data, such as text or images. By combining Python’s versatility with AI-driven automation, you can create highly customized visualizations that meet your specific needs.
Leveraging AI-Driven Plugins for Enhanced Insights
AI-driven plugins have emerged as powerful tools for enhancing data visualization. These plugins integrate with existing platforms, offering you additional features and capabilities that go beyond standard functionalities.
For example, Tableau’s AI plugins analyze data patterns and adjust visual parameters automatically. This ensures that your visualizations remain accurate and relevant, even as your dataset evolves. Similarly, Power BI’s plugins focus on uncovering hidden insights, helping you identify trends and anomalies that might otherwise go unnoticed.
Other plugins specialize in specific tasks, such as cleaning and organizing data. These tools prepare your dataset for visualization, ensuring consistency and accuracy. By automating these preliminary steps, AI-driven plugins allow you to focus on interpreting insights rather than managing data.
Some plugins also support collaboration by enabling multiple users to interact with the same visualization. This feature fosters teamwork and ensures that everyone involved can contribute to the decision-making process. Whether you’re working in finance, healthcare, or retail, AI-driven plugins enhance your ability to derive actionable insights from your data.
By integrating generative AI with popular tools and leveraging specialized plugins, you can elevate your data visualization efforts. These technologies empower you to create visuals that are not only informative but also engaging and impactful.
Challenges and Ethical Considerations in Using Generative AI
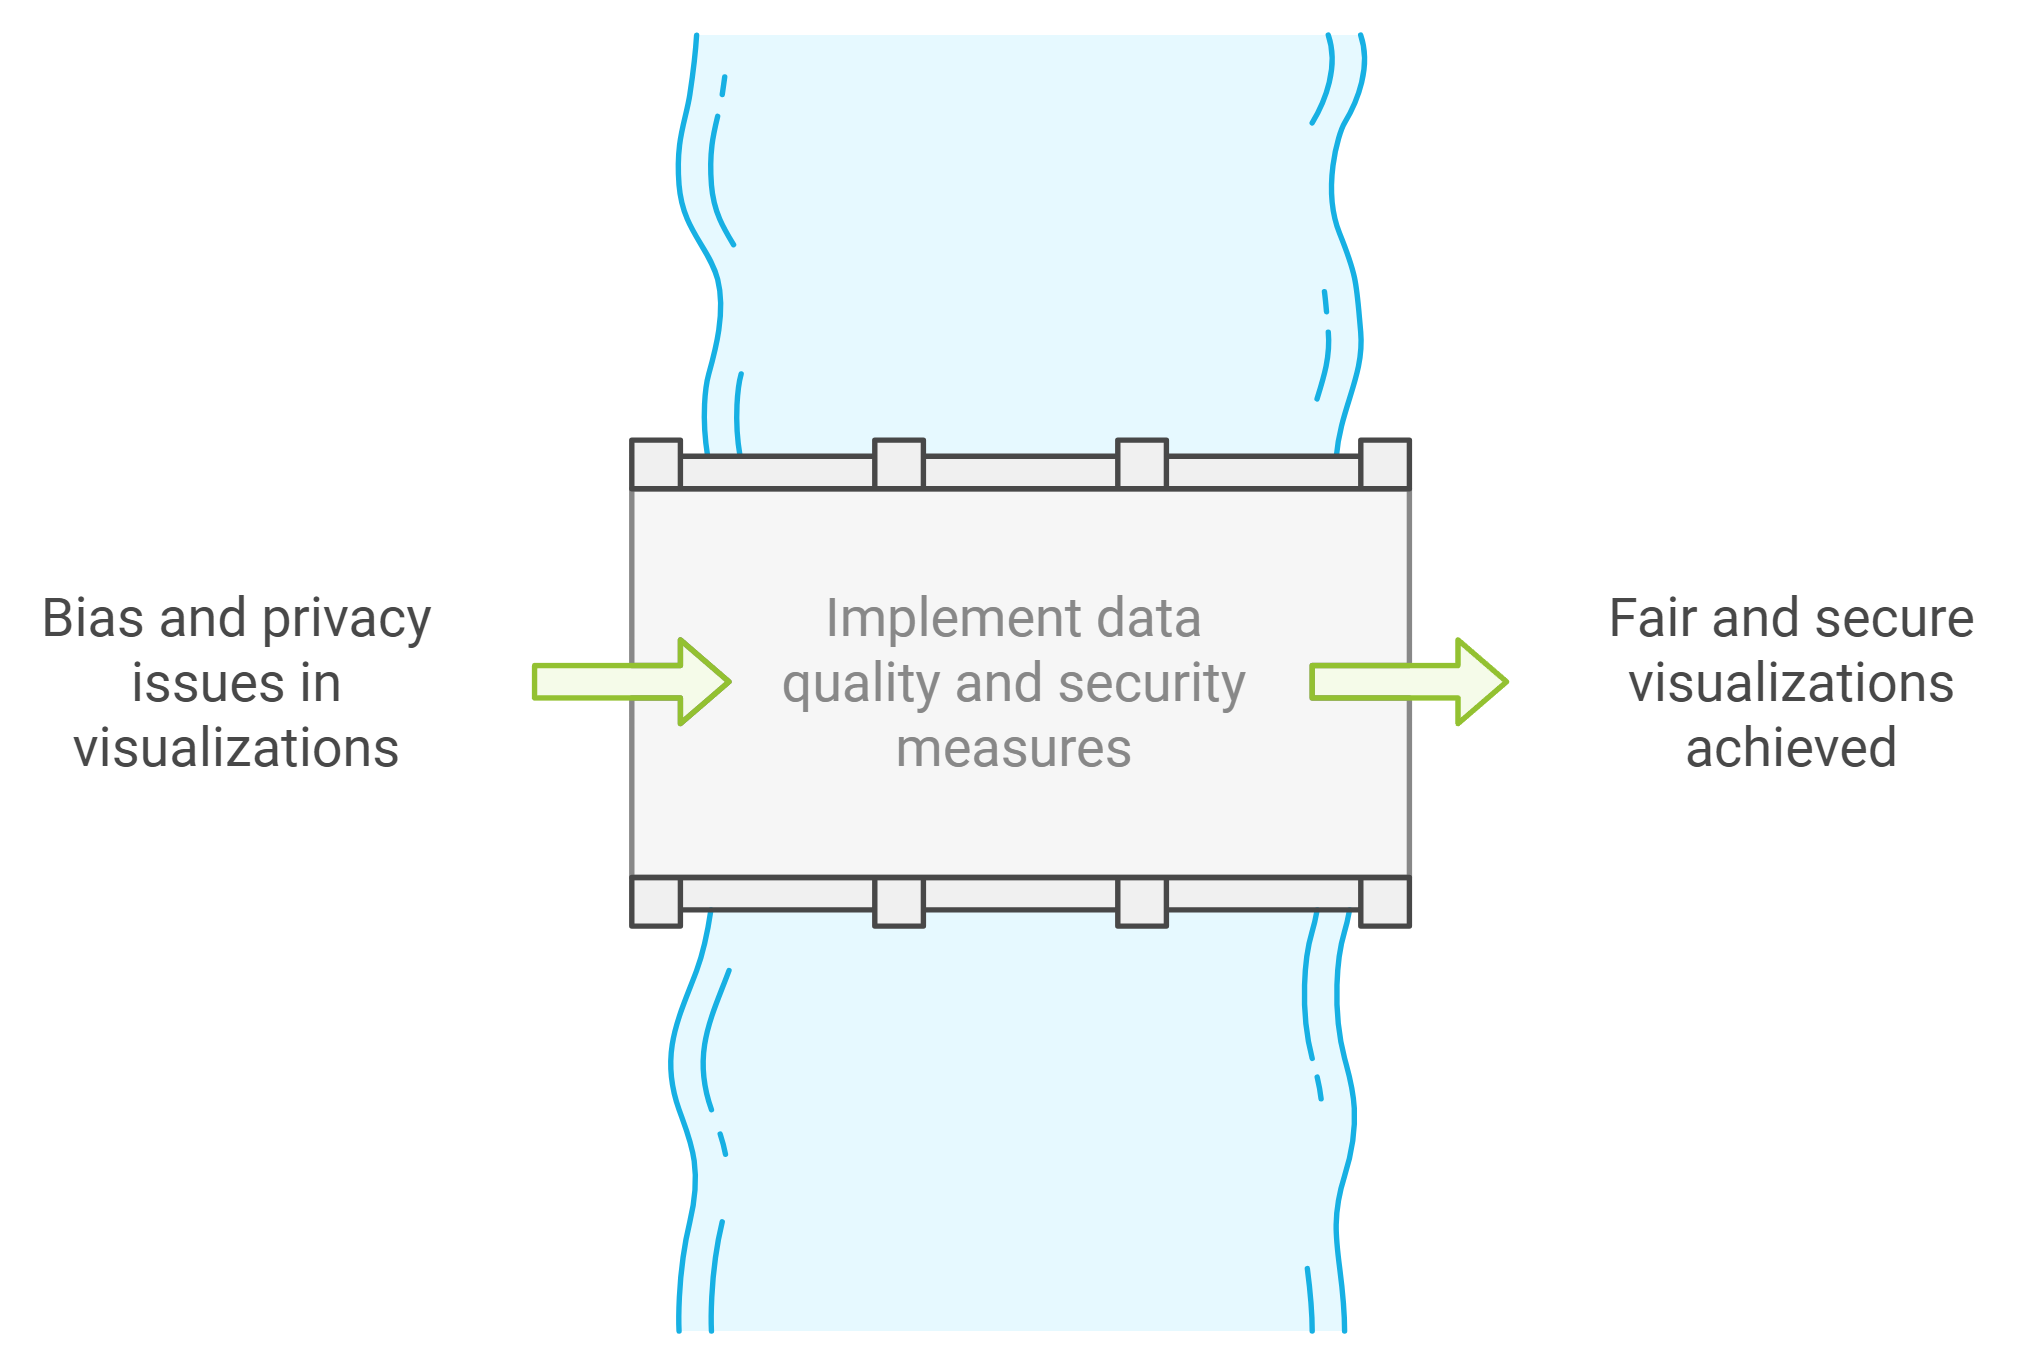
Addressing Bias in AI-Generated Visualizations
Generative AI can unintentionally introduce bias into visualizations, which may lead to misleading insights. You must actively address this issue to ensure fairness and accuracy in your data representations. Bias often arises from the data itself. If the data used to train AI models contains imbalances or reflects historical prejudices, the resulting visualizations will likely perpetuate those issues. For example, a dataset with underrepresented demographics may produce skewed outputs, affecting decision-making processes.
To mitigate bias, prioritize data quality during the preparation phase. Clean and balanced datasets form the foundation of unbiased visualizations. Use tools like Python libraries such as Pandas to preprocess your data and identify potential imbalances. Additionally, test your AI-generated visuals across diverse scenarios to detect any patterns of bias. Incorporating human oversight at this stage ensures that the outputs align with ethical standards.
Transparency also plays a key role. Document the sources of your data and the parameters used in your AI models. This practice allows stakeholders to understand the context behind the visualizations, fostering trust in the insights provided. By addressing bias proactively, you can create visualizations that are both equitable and reliable.
Ensuring Data Privacy and Security
Data privacy and security remain critical concerns when using generative AI for data visualization. You handle sensitive information, such as customer details or financial records, which requires robust safeguards to prevent unauthorized access or misuse. Neglecting these aspects can lead to significant risks, including data breaches and compliance violations.
Start by implementing strong encryption protocols to protect your data during storage and transmission. Tools like Power BI offer built-in security features that help you manage access controls and monitor data usage. Limit access to sensitive datasets by assigning permissions based on user roles. This approach minimizes the risk of unauthorized modifications or leaks.
Anonymization is another effective strategy. Remove personally identifiable information (PII) from your datasets before feeding them into AI models. This step ensures that the visualizations focus on trends and patterns without compromising individual privacy. Regularly audit your data workflows to identify vulnerabilities and address them promptly.
Compliance with data protection regulations, such as GDPR or CCPA, is non-negotiable. Familiarize yourself with the legal requirements relevant to your industry and region. By prioritizing privacy and security, you not only protect your data but also build trust with your audience.
Balancing Automation with Human Oversight
While generative AI automates many aspects of data visualization, human oversight remains essential to ensure meaningful and accurate outputs. Relying solely on AI can lead to errors or misinterpretations, especially when dealing with complex datasets. You must strike a balance between automation and manual intervention to achieve the best results.
Begin by reviewing the initial outputs generated by AI tools. Evaluate whether the visualizations effectively communicate the intended insights. For instance, Tableau and Power BI allow you to refine visual parameters through conversational prompts, enabling you to make adjustments in real-time. This iterative process ensures that the visuals align with your objectives.
Human expertise adds context and intuition that AI cannot replicate. You bring a deeper understanding of the data and its implications, which helps in interpreting the visualizations accurately. Collaborate with team members to gather diverse perspectives and validate the insights derived from AI-generated visuals.
Establish clear guidelines for when to intervene in the automation process. For example, set thresholds for anomalies or inconsistencies that require manual review. Document these protocols to maintain consistency across projects. By combining the efficiency of automation with the critical thinking of human oversight, you can create visualizations that are both accurate and insightful.
The Future of Generative AI in Data Visualization
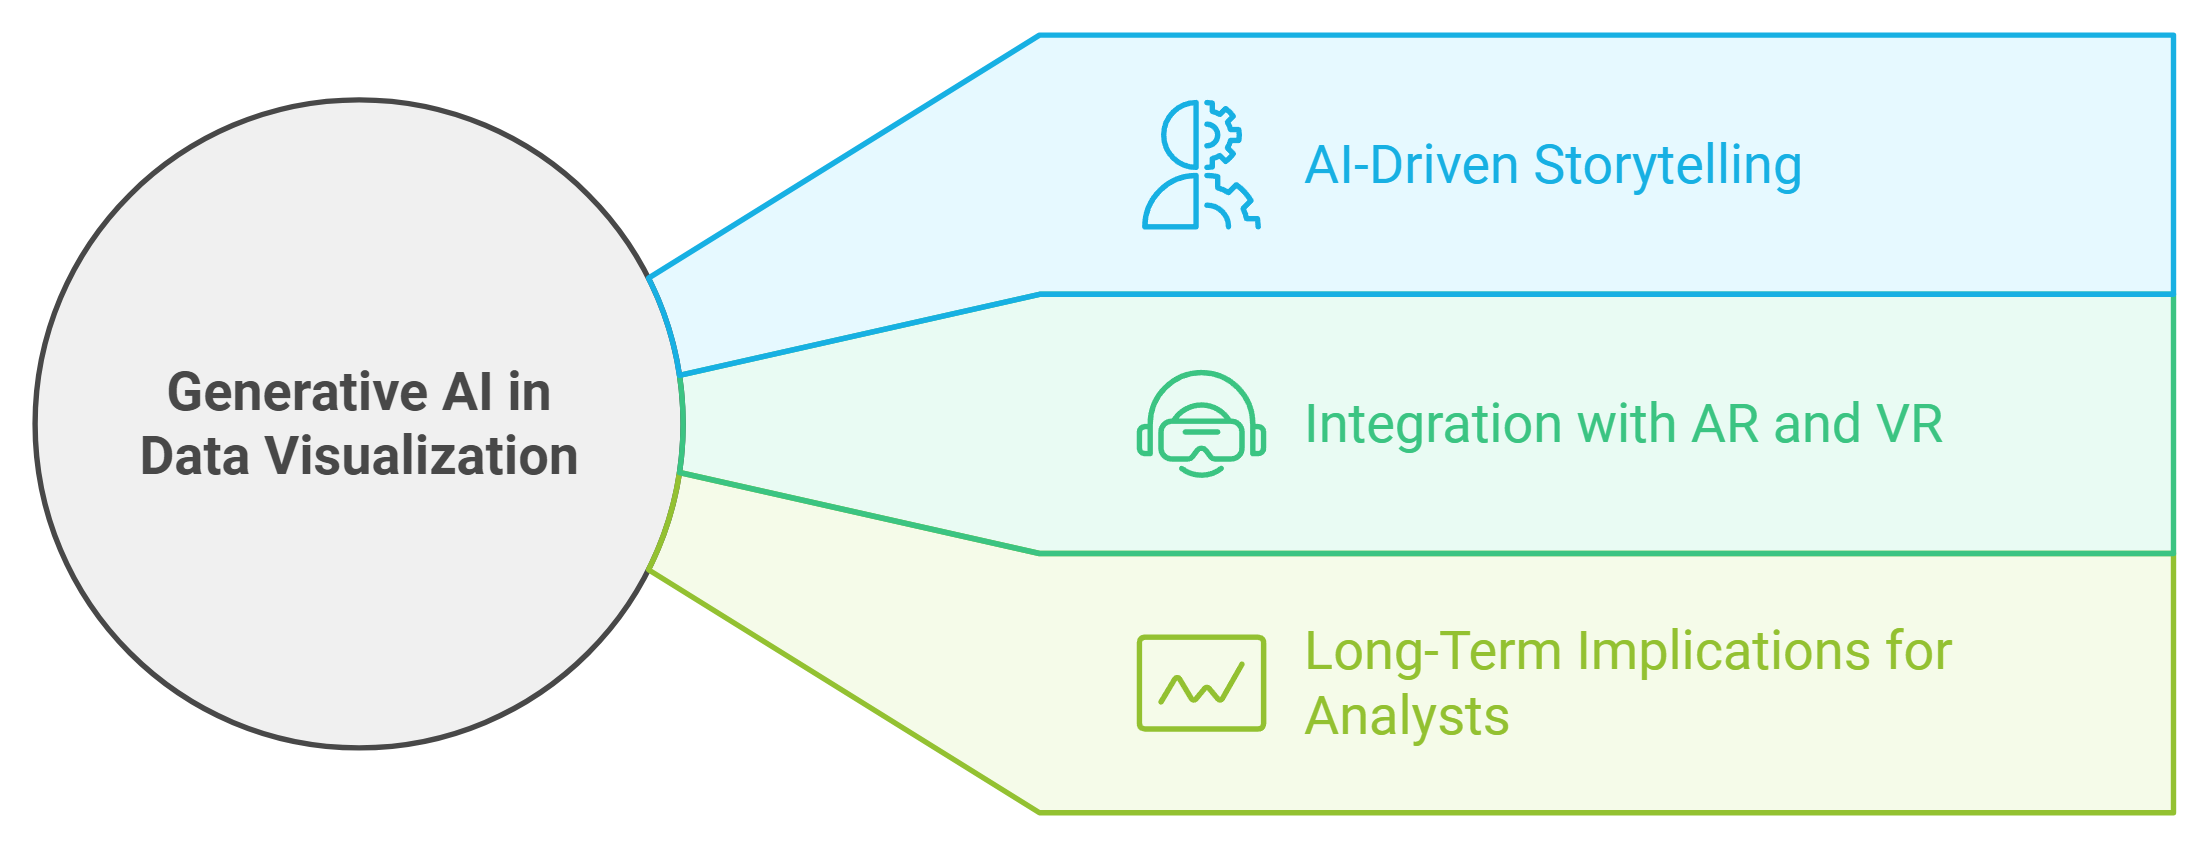
Emerging Trends in AI-Driven Storytelling
Generative AI is reshaping storytelling in data visualization by making it more dynamic and engaging. You can now create narratives that adapt to your audience's needs, ensuring the message resonates effectively. AI tools analyze data patterns and craft visual stories that highlight key insights, helping you communicate complex information with clarity.
One emerging trend is the use of natural language generation (NLG) to accompany visuals. For example, AI can generate descriptive text that explains the significance of a chart or graph, making the data more accessible. This feature proves especially useful when presenting to non-technical audiences. Additionally, AI-driven storytelling tools allow you to customize narratives based on real-time data updates, ensuring your story remains relevant.
Another trend involves interactive storytelling. Generative AI enables you to create visualizations that respond to user inputs, allowing viewers to explore data from different angles. This interactivity fosters deeper engagement and helps uncover insights that static visuals might miss. By embracing these trends, you can transform data into compelling stories that drive informed decision-making.
Integration with Augmented and Virtual Reality
The integration of generative AI with augmented reality (AR) and virtual reality (VR) is revolutionizing how you experience data visualization. These technologies bring data to life by creating immersive environments where you can interact with visualizations in three dimensions. For instance, AR can overlay data insights onto physical objects, providing context in real-world settings.
In VR, generative AI creates virtual spaces where you can explore complex datasets intuitively. Imagine walking through a 3D representation of market trends or navigating a virtual city map to analyze urban planning data. These experiences make it easier to identify patterns and relationships that might be difficult to spot in traditional 2D charts.
Generative AI enhances AR and VR by automating the creation of these immersive visuals. It processes large datasets efficiently, ensuring the outputs are both accurate and visually appealing. By integrating these technologies, you can offer your audience a more engaging and impactful way to interact with data.
Long-Term Implications for Data Analysts and Decision-Making
Generative AI is set to redefine the role of data analysts and the decision-making process. As AI automates repetitive tasks like data cleaning and visualization creation, you can focus more on interpreting insights and developing strategies. This shift allows you to add greater value to your organization by leveraging your expertise in context and critical thinking.
However, this transformation also brings challenges. You must remain vigilant about the ethical implications of using AI. For example, biases in training data can lead to skewed visualizations, potentially resulting in flawed decisions. By maintaining oversight and critically evaluating AI-generated outputs, you ensure the insights remain accurate and unbiased.
The long-term impact extends to decision-making as well. Generative AI provides real-time insights and predictive analytics, enabling you to make proactive choices. Yet, relying solely on AI without human judgment can lead to oversights. Balancing automation with human expertise ensures decisions are both data-driven and contextually sound.
As generative AI continues to evolve, its integration into data visualization will empower you to uncover deeper insights and make more informed decisions. By staying adaptable and embracing these advancements responsibly, you can harness the full potential of this transformative technology.
Generative AI is revolutionizing data visualization by helping you uncover hidden patterns and transform raw data into actionable insights. It empowers you to craft impactful narratives that make complex information accessible and meaningful. By integrating generative AI with existing tools and adopting best practices, you can unlock the full potential of your data. The future of visualization lies in combining AI's efficiency with your expertise, enabling more intuitive and effective decision-making. Embracing this technology ensures you stay competitive in an increasingly data-driven world.
FAQ
What is generative AI, and how does it differ from traditional AI?
Generative AI creates new content, such as images, text, or data visualizations, by learning patterns from existing datasets. Traditional AI focuses on analyzing and interpreting data to provide insights. Generative AI goes a step further by producing outputs that mimic human creativity, such as crafting dynamic charts or interactive dashboards.
How does generative AI improve data visualization?
Generative AI enhances data visualization by automating the creation of visuals, uncovering hidden patterns, and generating real-time updates. It uses advanced techniques like neural networks and natural language processing to transform raw data into meaningful visuals. This process saves time, reduces errors, and ensures that your visualizations effectively communicate insights.
Which industries benefit the most from generative AI in data visualization?
Generative AI impacts multiple industries, including healthcare, finance, retail, and urban planning. For example:
Healthcare: It creates detailed visualizations of patient imaging data, improving diagnostic accuracy.
Finance: It generates real-time charts for market trends, aiding in better investment decisions.
Urban Planning: It simulates growth scenarios and visualizes infrastructure needs for sustainable development.
Can generative AI handle large datasets effectively?
Yes, generative AI excels at processing large datasets. It automates workflows, ensuring scalability and efficiency. Tools like Tableau and Power BI integrate generative AI to manage complex data streams, allowing you to create dynamic visualizations that adapt as your dataset grows.
What tools can I use to integrate generative AI into my data visualization process?
Popular tools like Tableau, Power BI, and Python libraries such as Matplotlib and Plotly offer robust generative AI integrations. These tools automate visualization creation, provide real-time updates, and support interactive dashboards. Choosing the right tool depends on your specific needs and the complexity of your data.
How does generative AI ensure accuracy in visualizations?
Generative AI minimizes errors by automating data analysis and identifying inconsistencies or anomalies. Neural networks and reinforcement learning refine visual outputs over time. By starting with clean, structured data and validating results, you can ensure accurate and reliable visualizations.
Is generative AI suitable for beginners in data visualization?
Yes, generative AI simplifies the visualization process, making it accessible even for beginners. Many tools offer user-friendly interfaces and conversational prompts, allowing you to create impactful visuals without extensive technical expertise. For instance, Power BI and Tableau guide users through the process with AI-driven recommendations.
What are the ethical considerations when using generative AI for data visualization?
Ethical concerns include addressing bias, ensuring data privacy, and maintaining human oversight. To mitigate bias, use balanced datasets and validate AI-generated outputs. Protect sensitive information by anonymizing data and following privacy regulations like GDPR. Always combine AI automation with human judgment to ensure fairness and accuracy.
How will generative AI shape the future of data visualization?
Generative AI will drive innovations like AI-driven storytelling, real-time predictive analytics, and integration with augmented and virtual reality. By 2025, 75% of data stories are expected to be generated using augmented analytics techniques. These advancements will make data visualization more dynamic, engaging, and accessible, empowering you to make informed decisions.
What is the economic impact of generative AI in data visualization?
Generative AI has a significant economic impact, with an estimated contribution of $6.1-7.9 trillion annually. The market is projected to grow at a CAGR of 36.7% from 2024 to 2030. This growth highlights its increasing importance in transforming how businesses analyze and present data.
See Also
Leveraging Data Leadership Effectively During the AI Revolution
The Role of Data Governance in Fostering Innovation
Shifting from Traditional BI to AI Insights with Eric Kavanagh
