A Practical Guide to Spotting Dirty Data in Your Dataset

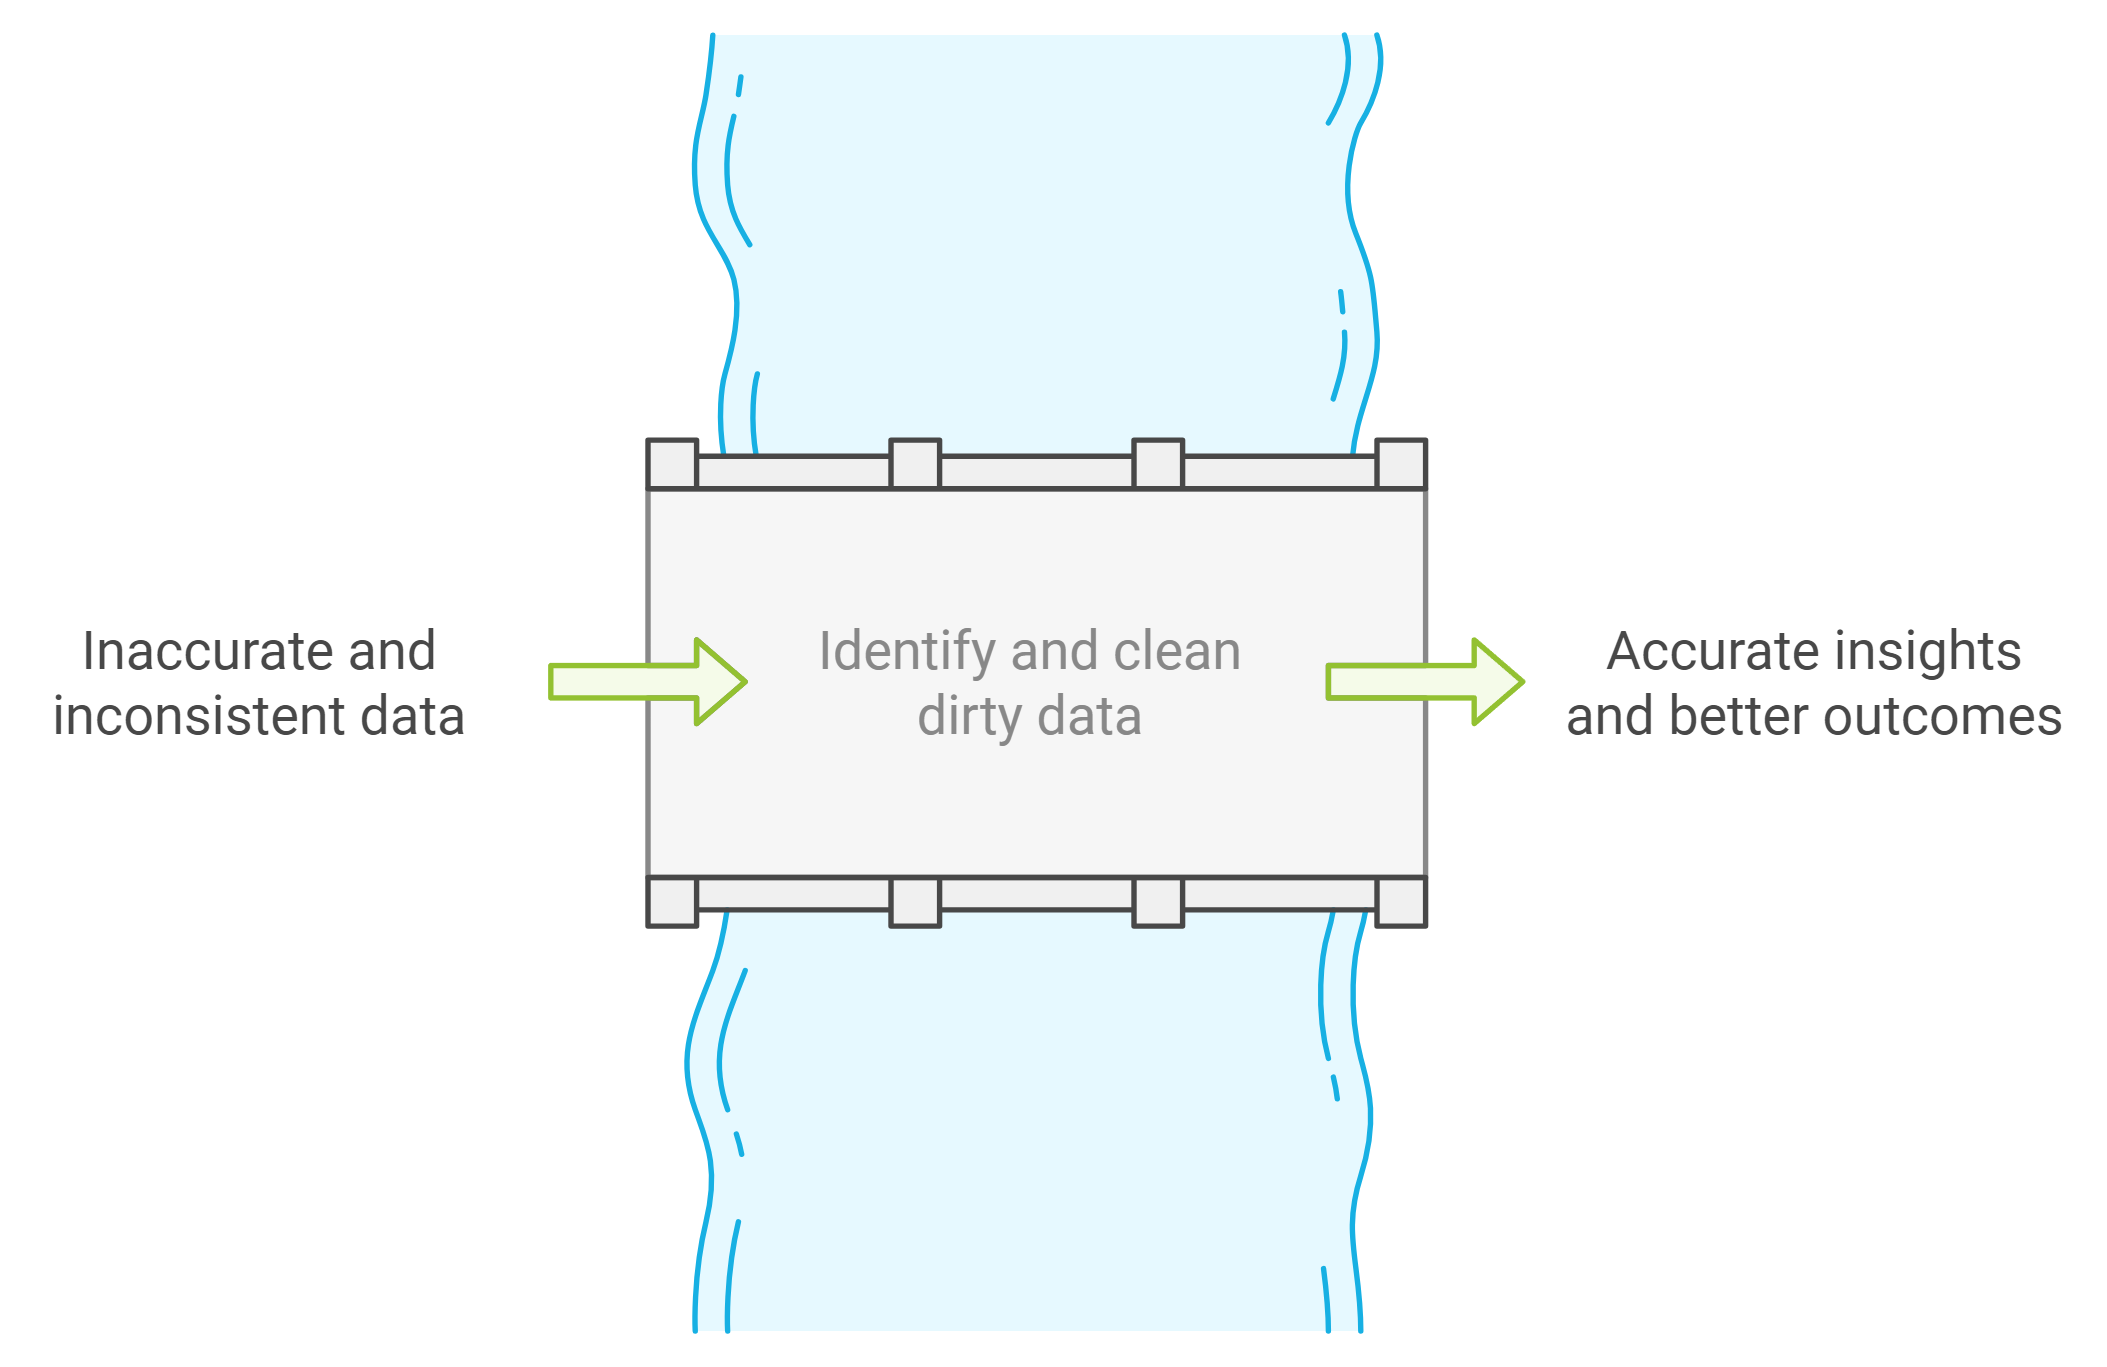
Dirty data refers to inaccurate, inconsistent, or incomplete information that can disrupt your dataset's reliability. It undermines the foundation of decision-making, leading to costly mistakes. For instance, businesses lose an average of $12.9 million annually due to poor data quality. Dirty data also affects operational efficiency, customer relationships, and marketing efforts. To effectively identify dirty data is essential to avoid these pitfalls. By addressing it early, you ensure accurate analysis and better outcomes. The importance of data cleaning cannot be overstated—it safeguards the integrity of your insights and decisions.
Key Takeaways
Dirty data can lead to significant financial losses, with businesses losing an average of $12.9 million annually due to poor data quality.
Common types of dirty data include duplicates, missing values, inconsistent entries, and outliers, all of which can skew analysis and decision-making.
Implementing data entry standards and validation rules can significantly reduce the occurrence of dirty data from the outset.
Regular audits and the use of automated tools like Pandas or OpenRefine can help identify and clean dirty data efficiently.
Proactive data quality management not only prevents costly errors but also enhances operational efficiency and customer satisfaction.
Maintaining original raw datasets allows for transparency and reanalysis, ensuring that data cleaning efforts do not compromise valuable information.
Focusing on high-impact data and aligning cleaning efforts with business goals maximizes the effectiveness of your data management strategy.
What is Dirty Data?
Dirty data refers to information in your dataset that contains errors, inconsistencies, or inaccuracies. It disrupts the reliability of your analysis and can lead to flawed conclusions. Understanding what dirty data is and how it manifests is the first step to maintaining clean, actionable datasets.
Definition of Dirty Data
Dirty data includes any information that compromises the quality of your dataset. This could be due to human error, outdated records, or technical glitches during data collection. For example, duplicate entries in a customer database or missing fields in survey results are common forms of dirty data. These issues may seem minor, but they can significantly impact your ability to draw accurate insights.
"If there is a bug in the data collection or processing algorithm from the beginning, then all the results of data analysis will be incorrect, warped, or corrupted, even if they seem plausible," states Alexander Konduforov. This highlights the importance of identifying and addressing dirty data early in the process.
Common Types of Dirty Data
Dirty data can take many forms. Below are the most common types you should watch for in your dataset:
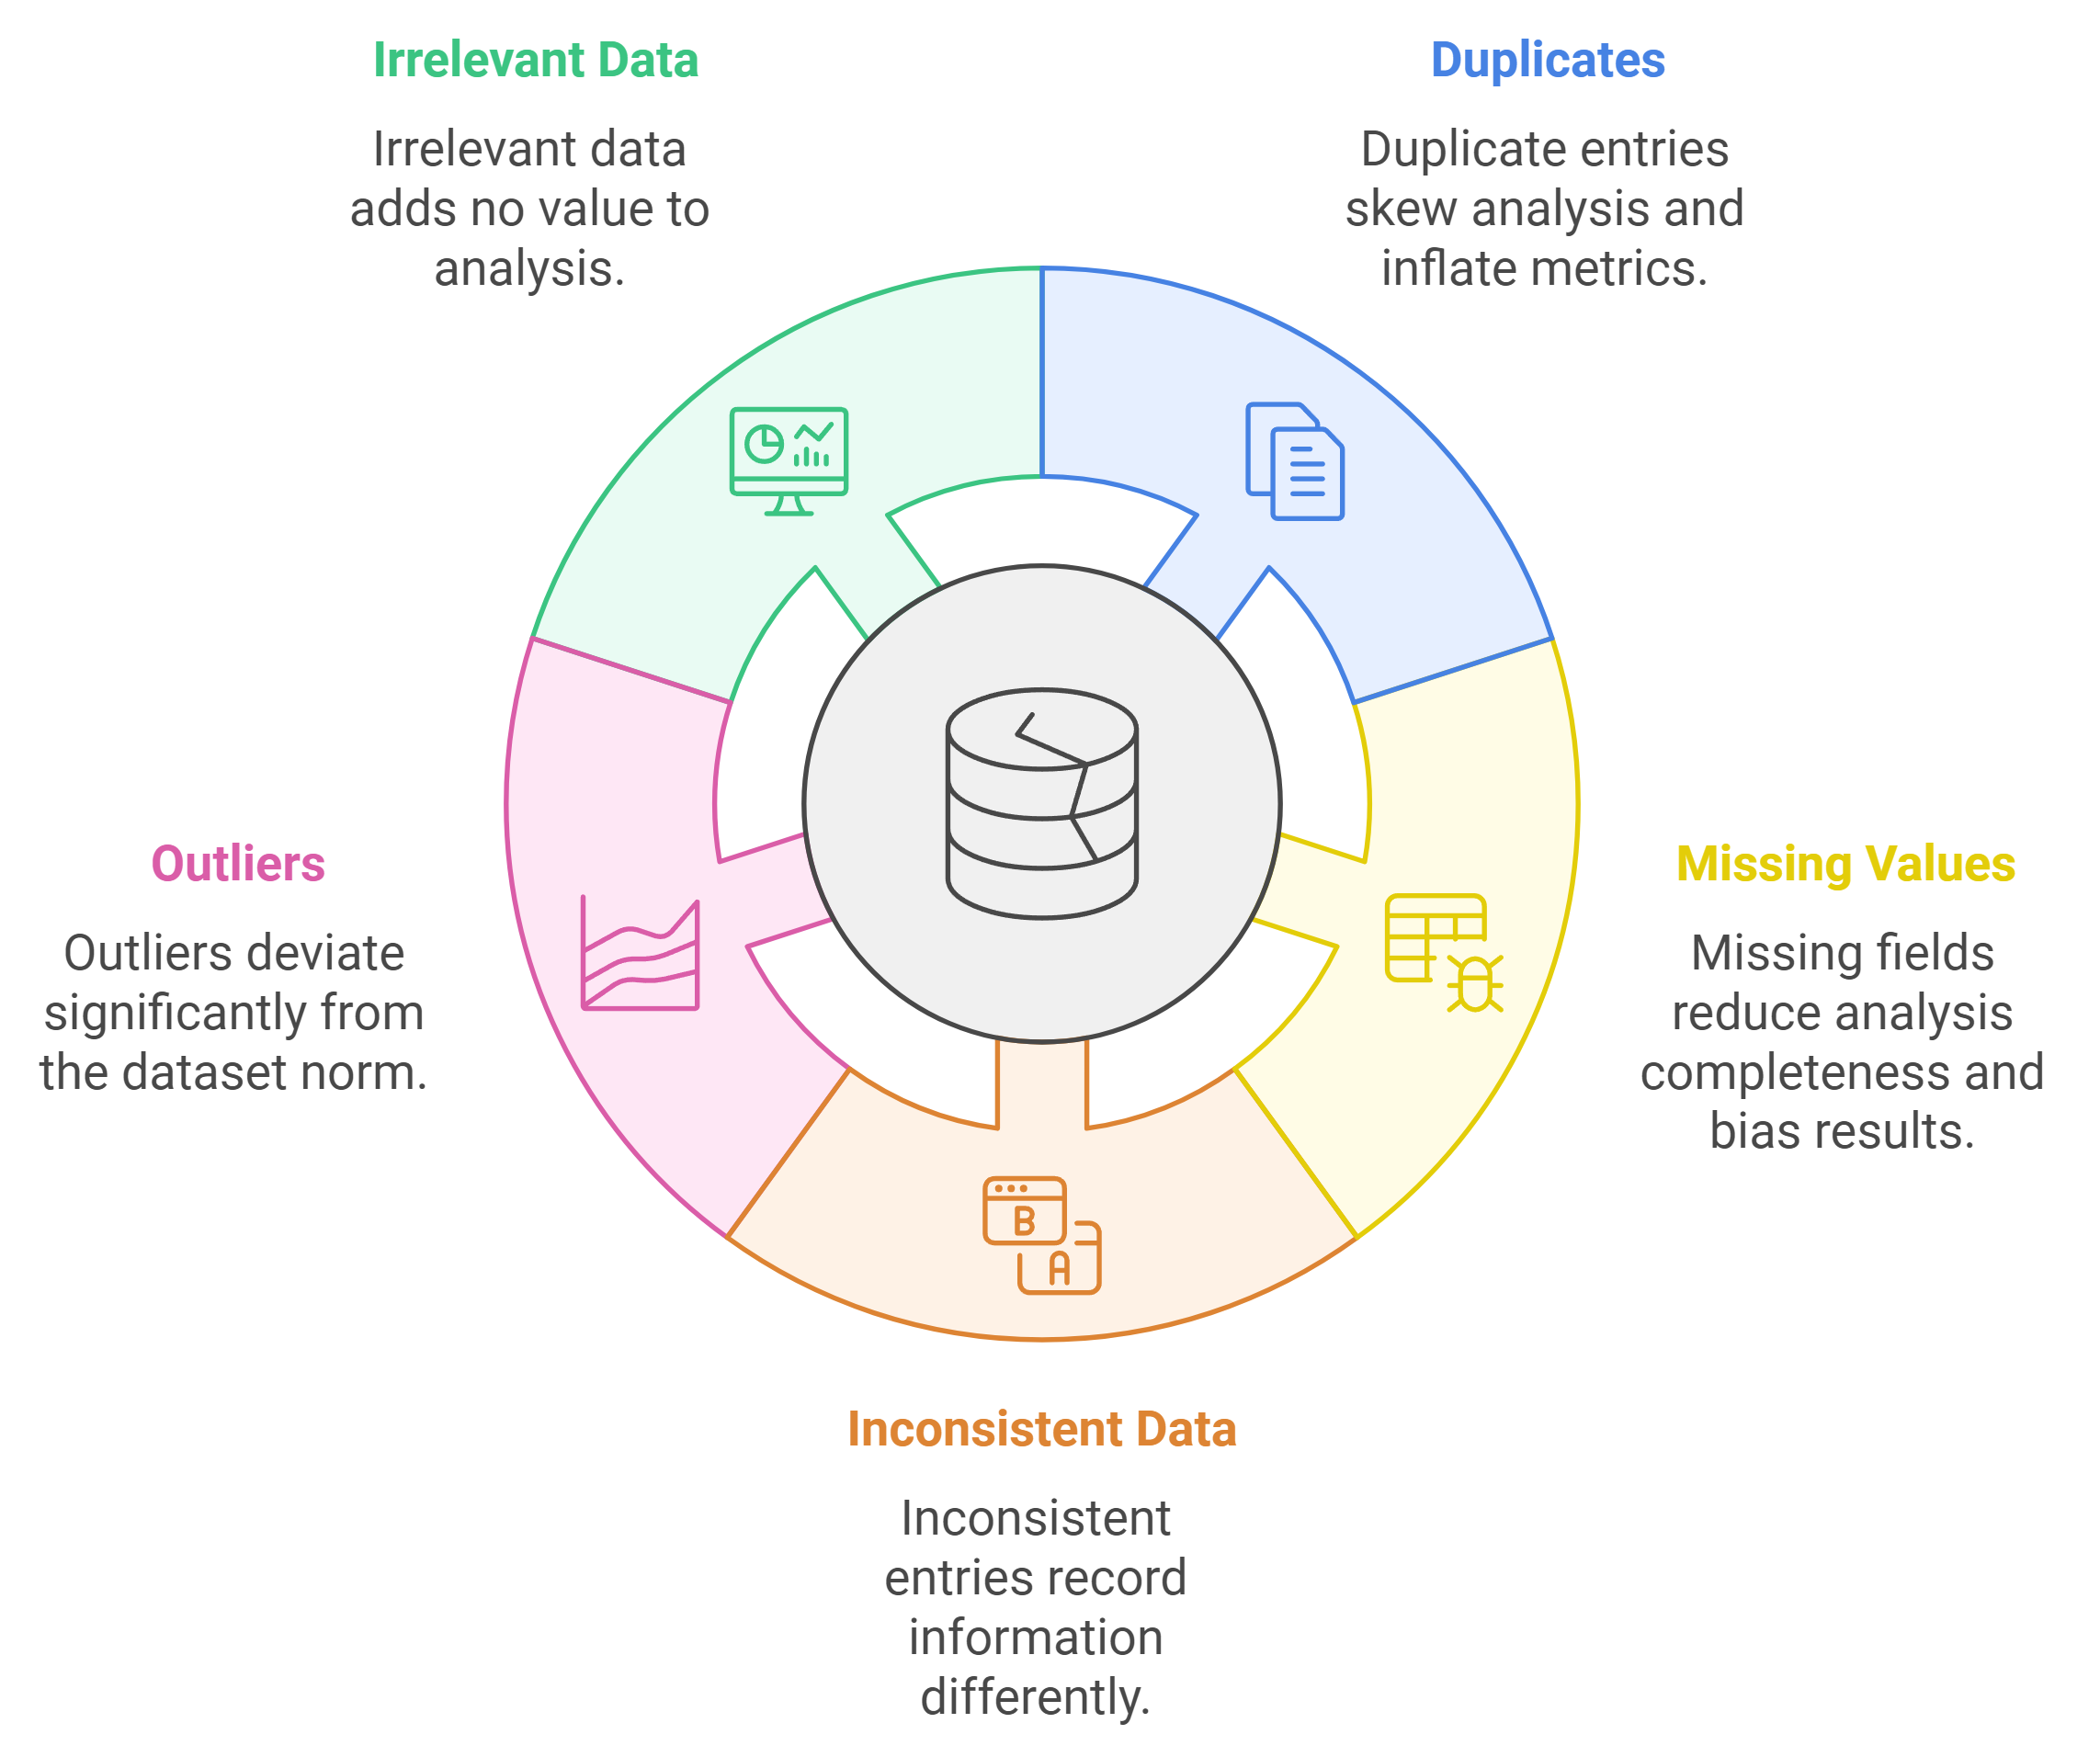
Duplicates
Duplicate data occurs when the same record appears multiple times in your dataset. For instance, a customer might be listed twice with slight variations in their name or contact details. These duplicates can skew your analysis and inflate metrics like customer counts or sales figures.
Missing Values
Missing values happen when certain fields in your dataset are left blank or incomplete. For example, a survey response might lack answers to key questions. Missing data reduces the completeness of your analysis and can lead to biased results.
Inconsistent or Conflicting Data
Inconsistent data arises when the same information is recorded differently across entries. For example, one record might list a state as "CA," while another spells it out as "California." Conflicting data, on the other hand, occurs when two records provide contradictory information, such as different birthdates for the same individual.
Outliers and Anomalies
Outliers are data points that deviate significantly from the rest of your dataset. For example, a single transaction worth $1,000,000 in a dataset where most transactions range between $10 and $100 is an outlier. While some outliers are valid, others may indicate errors or anomalies that need further investigation.
Irrelevant or Redundant Data
Irrelevant data includes information that does not contribute to your analysis. For example, storing a customer’s favorite color in a dataset meant for financial forecasting adds no value. Redundant data, on the other hand, repeats information unnecessarily, increasing storage costs and complicating analysis.
Key Insight: Cleaning dirty data not only improves the accuracy of your analysis but also helps identify risks and opportunities more effectively. By addressing these common types of dirty data, you ensure that your dataset remains a reliable foundation for decision-making.
Why Identifying Dirty Data Matters
Dirty data can derail your efforts to make informed decisions, streamline operations, and build reliable models. Understanding its impact helps you prioritize data cleaning and maintain the integrity of your dataset.
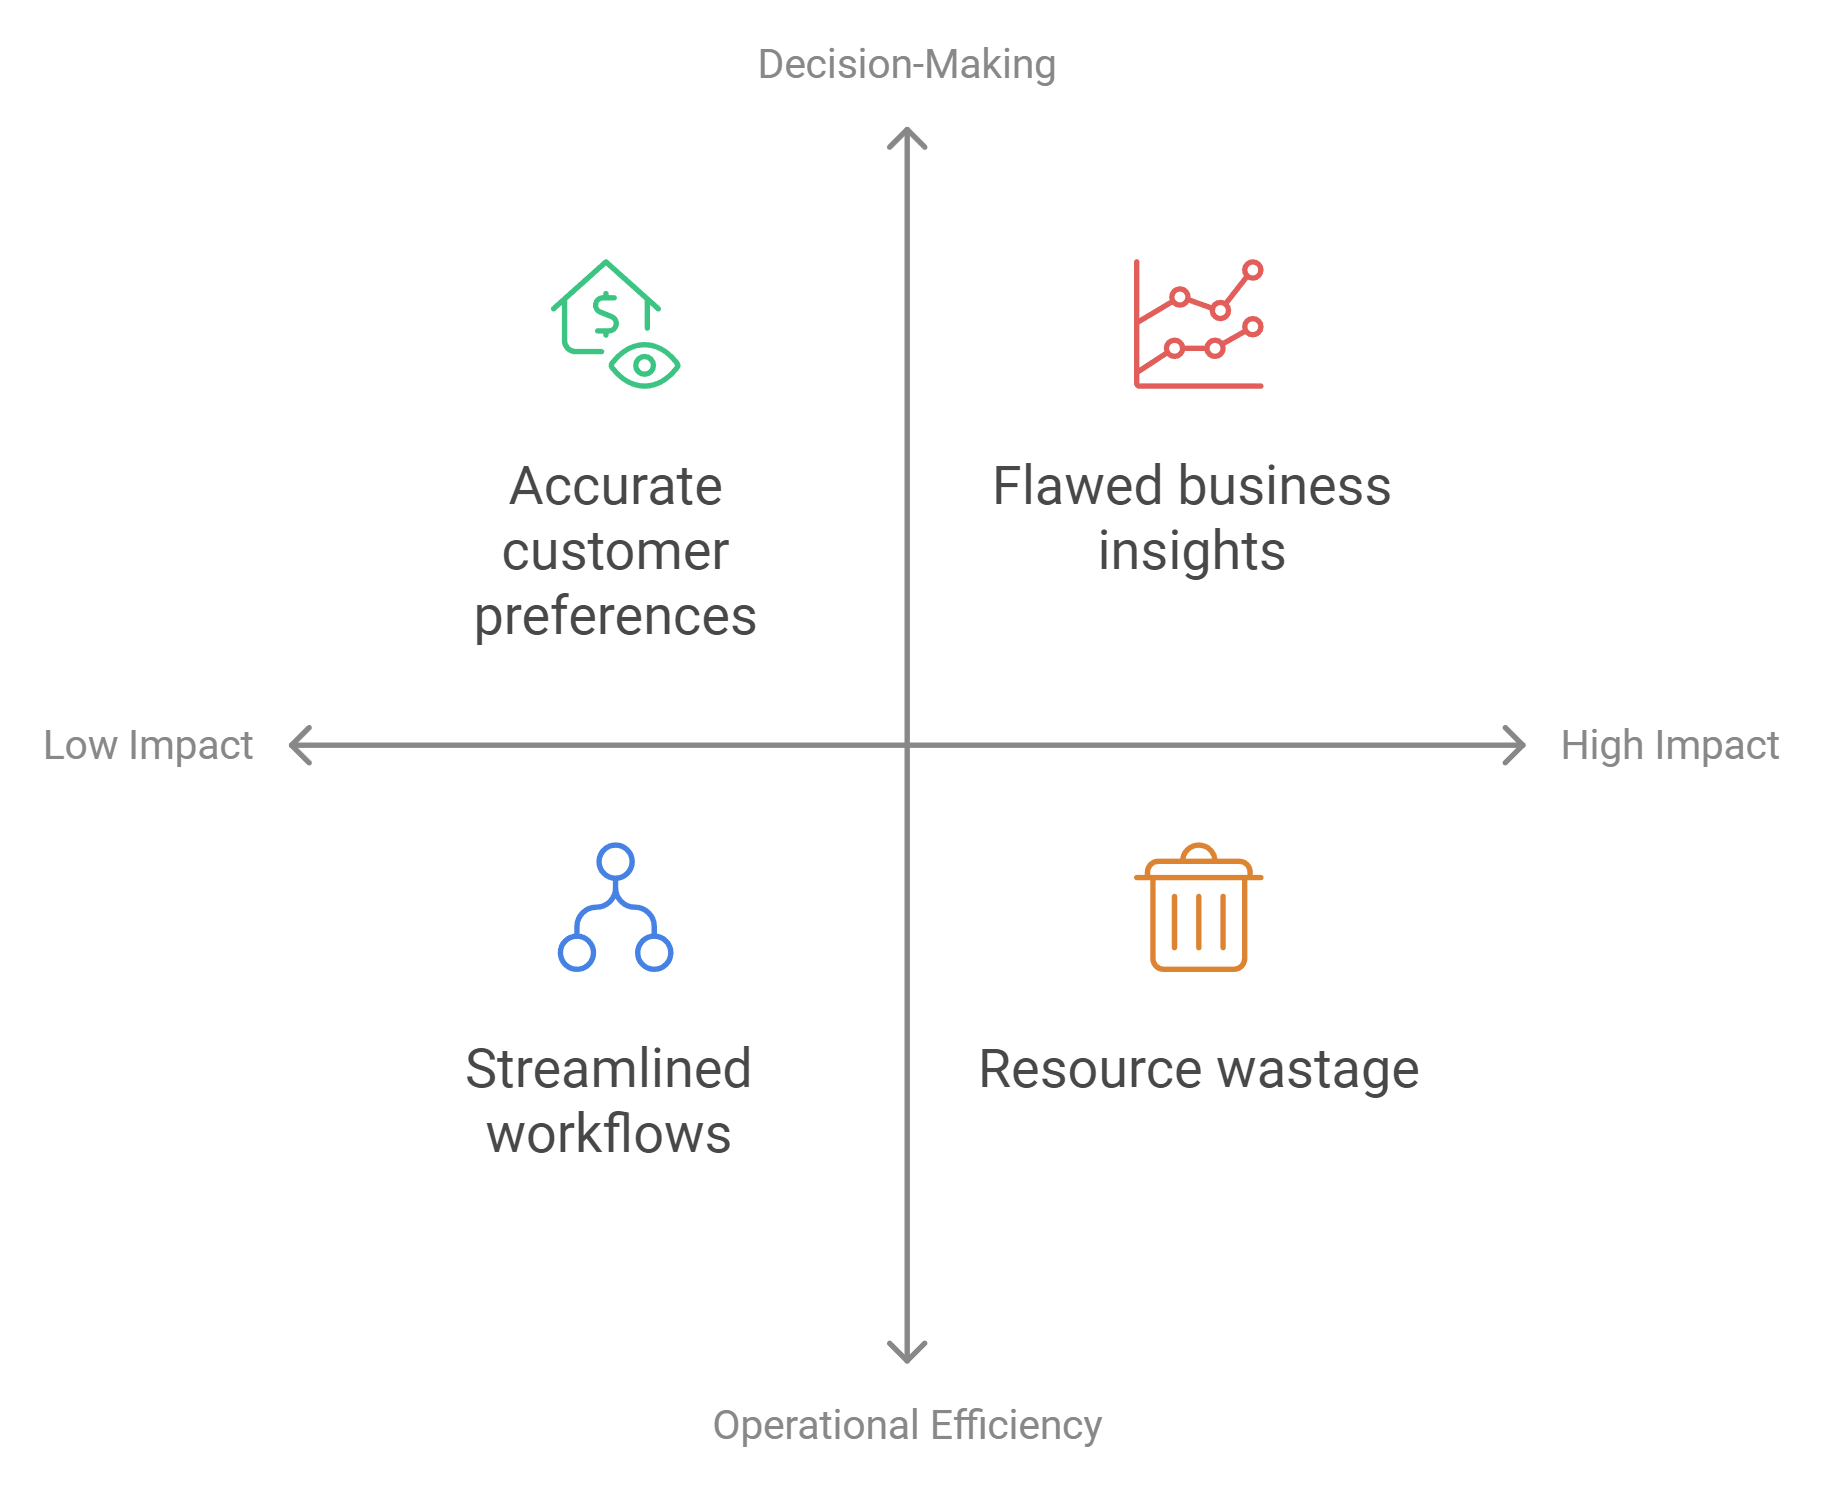
Impact on Decision-Making and Business Insights
Your decisions rely on accurate and trustworthy data. Dirty data introduces errors that distort your analysis and lead to flawed conclusions. For example, duplicate customer records can inflate sales figures, while missing values in survey results may skew insights. Clean data ensures that your decisions are based on facts, not inaccuracies.
"Clean data leads to better insights, efficient processes, and trustworthy analytics," as experts emphasize. By identifying dirty data, you safeguard your ability to extract meaningful business insights.
Accurate data also strengthens your competitive edge. It allows you to understand customer preferences, track market trends, and evaluate competitor performance. Dirty data, on the other hand, disrupts these processes and hampers your ability to stay ahead in the market.
Consequences for Operational Efficiency
Dirty data wastes time and resources. Employees spend hours fixing errors, reconciling inconsistencies, and re-entering information. This inefficiency slows down operations and diverts attention from strategic tasks. For instance, redundant data increases storage costs and complicates database management.
Clean data streamlines workflows and boosts productivity. It ensures that your team works with reliable information, reducing delays and errors. Businesses with clean data experience smoother operations, happier employees, and improved customer satisfaction.
Key Insight: Clean data enhances operational efficiency by eliminating unnecessary tasks and ensuring seamless processes. Dirty data, however, disrupts databases and affects key functions like segmentation and lead scoring.
Effects on Data Analysis and Machine Learning Models
Dirty data compromises the accuracy of your analysis and models. Outliers, missing values, and inconsistencies can skew results, leading to unreliable predictions. For example, a machine learning model trained on dirty data may misclassify customers or fail to detect fraud.
Clean data is essential for building robust models. It ensures that your algorithms learn from accurate and consistent information. This improves the reliability of your predictions and enhances the value of your analytics.
"Clean data provides a strategic edge, better insights, and competitive intelligence," making it a cornerstone of successful data analysis. Identifying dirty data early prevents costly errors and maximizes the potential of your models.
How to Identify Dirty Data in Your Dataset
Identifying dirty data is a crucial step in ensuring the accuracy and reliability of your dataset. By systematically examining your data for common issues, you can address errors before they impact your analysis. Below are practical methods to help you identify dirty data effectively.
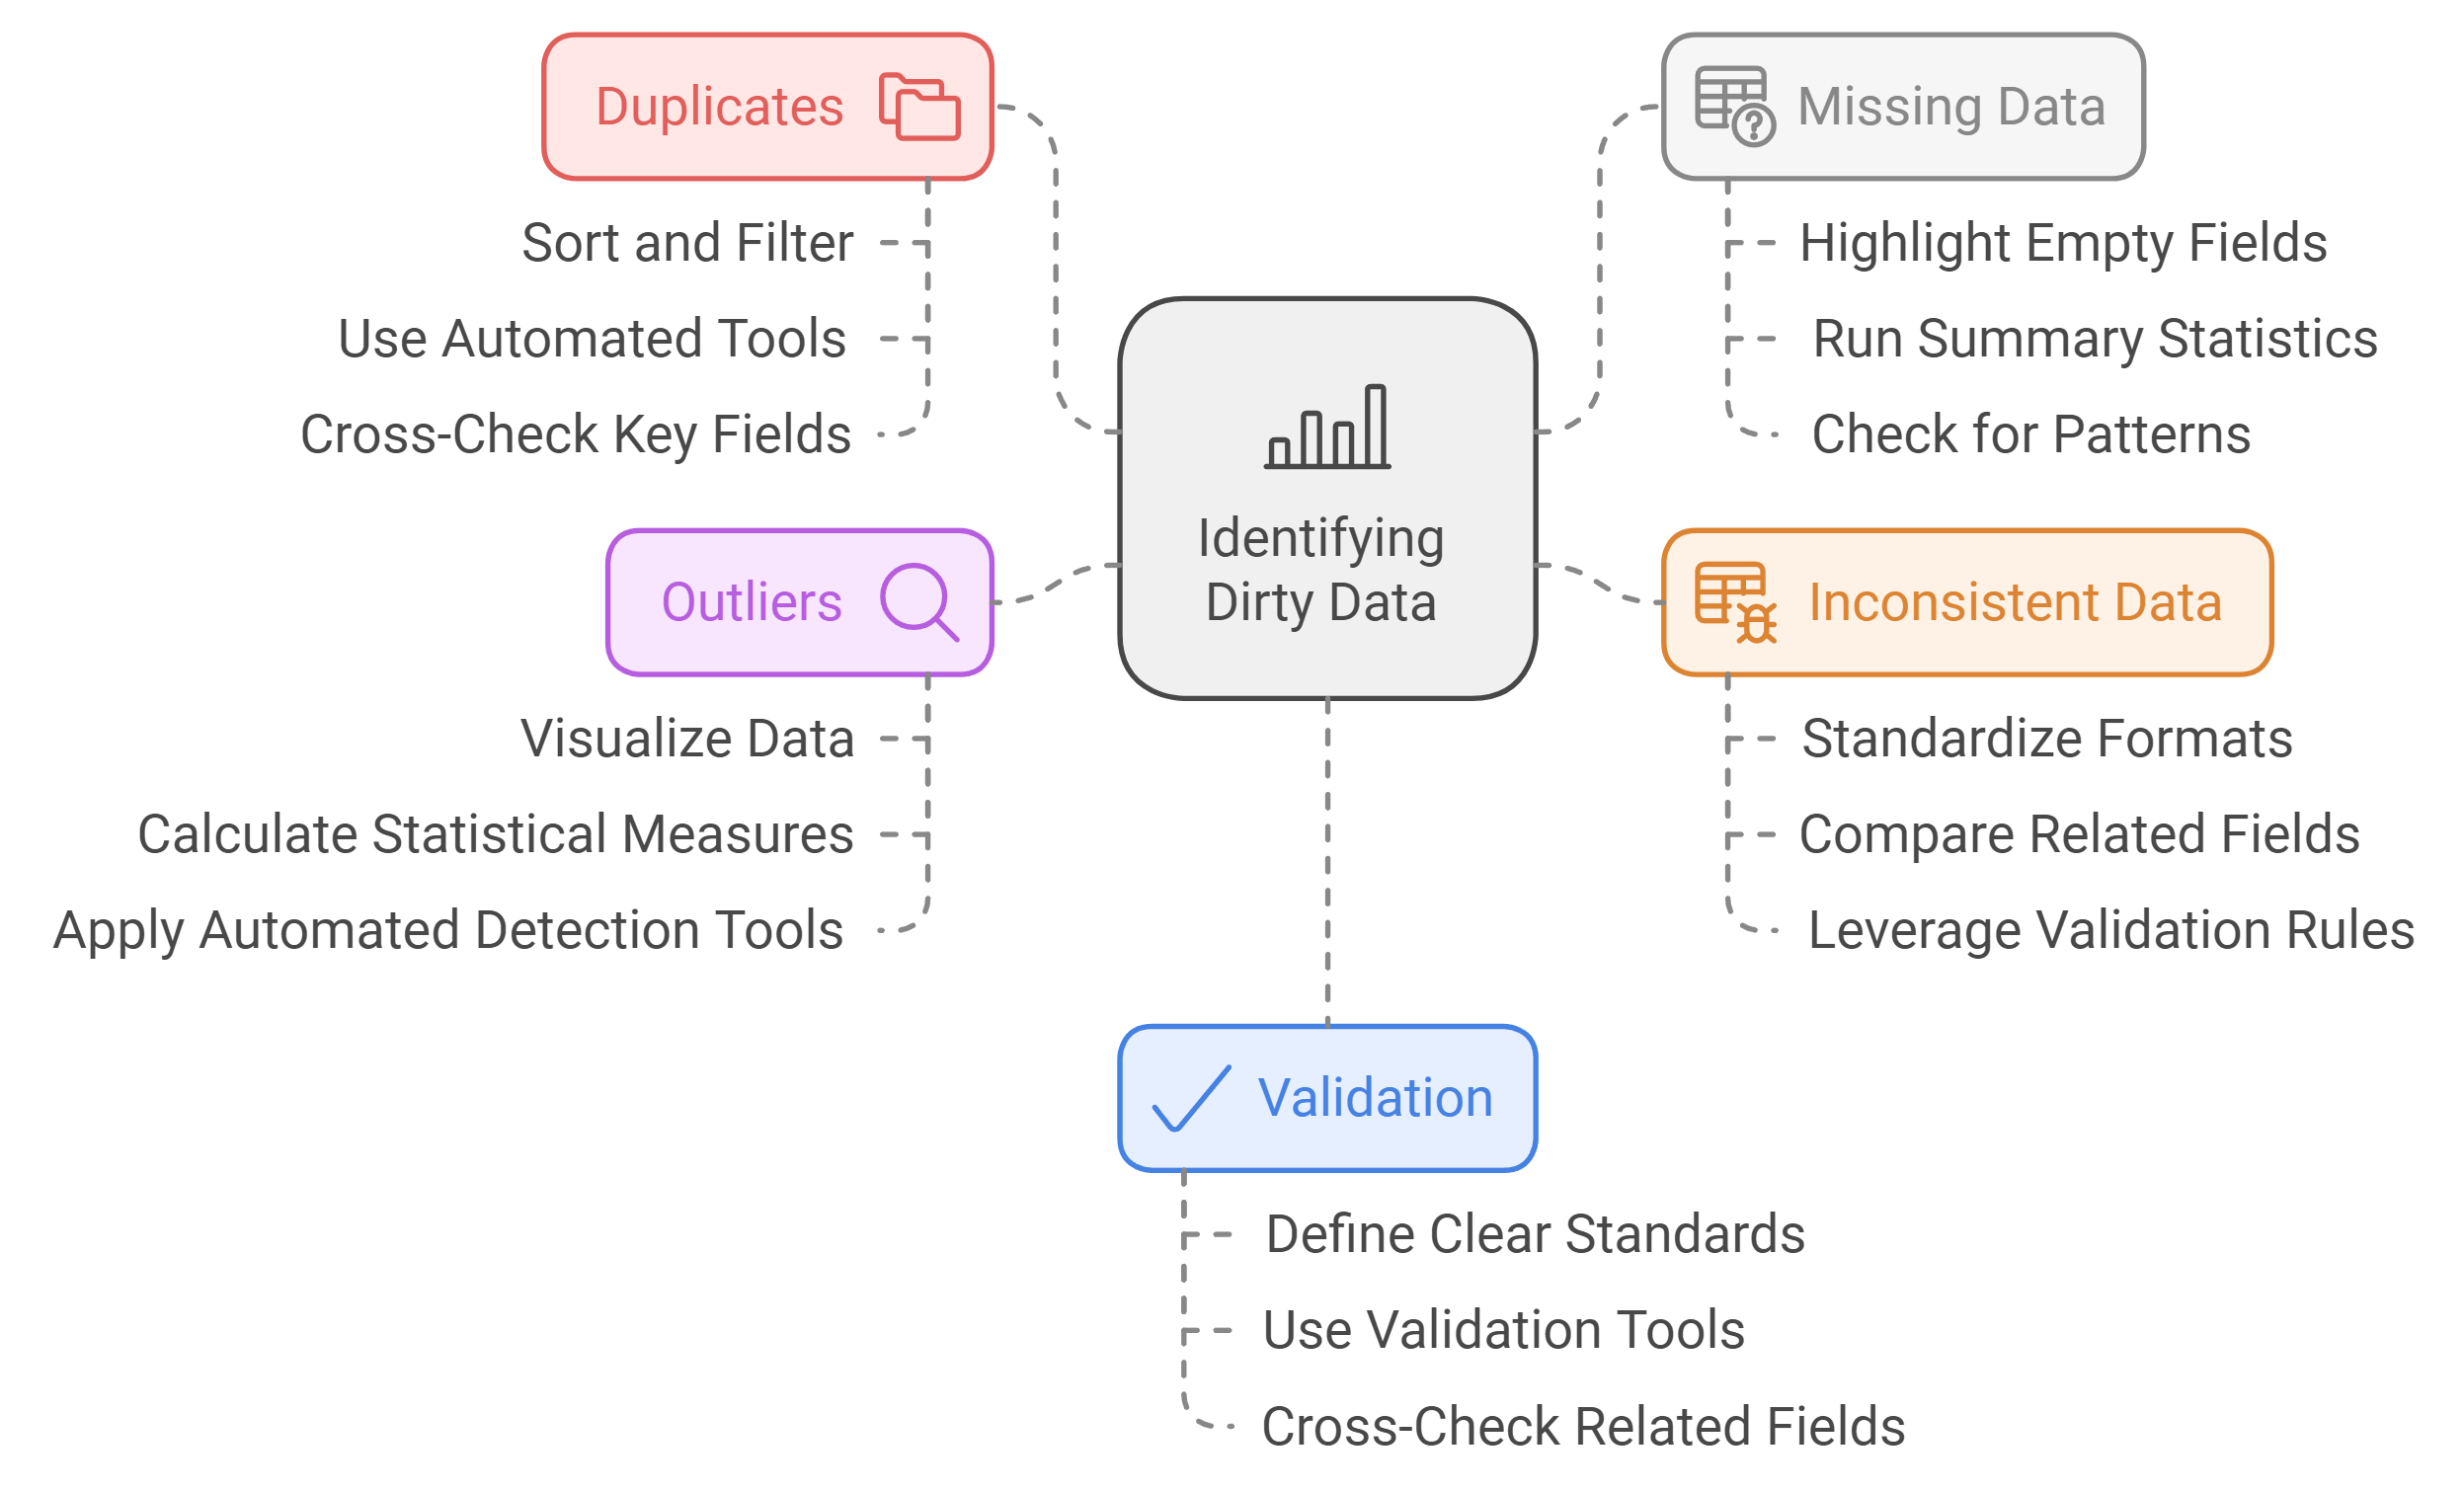
Check for Duplicates
Duplicate data occurs when the same record appears multiple times in your dataset. These duplicates can distort your analysis and lead to inflated metrics. For example, if invoices are duplicated, your financial totals may show outlying values, which could mislead decision-making. Similarly, duplicating customer records or products can result in higher costs, such as excess inventory or inefficient workflows.
To identify duplicates:
Sort and Filter: Use tools like Excel or Google Sheets to sort your data by key fields (e.g., customer ID, product name). This makes duplicate entries easier to spot.
Use Automated Tools: Leverage data cleaning software like OpenRefine or Python libraries like Pandas to detect and remove duplicates efficiently.
Cross-Check Key Fields: Focus on unique identifiers, such as email addresses or order numbers, to ensure no record appears more than once.
Pro Tip: Scrubbing duplicate values not only improves data accuracy but also reduces storage costs and prevents repetitive customer communication.
Identify Missing or Incomplete Data
Missing data can weaken your analysis by creating gaps in your dataset. For instance, survey responses with unanswered questions may lead to biased results. Incomplete records also hinder your ability to draw meaningful insights.
To identify missing data:
Highlight Empty Fields: Use conditional formatting in spreadsheet tools to highlight blank cells.
Run Summary Statistics: Calculate the percentage of missing values in each column to understand the extent of the issue.
Check for Patterns: Look for trends in missing data. For example, certain fields might be incomplete for specific groups or time periods.
Addressing missing data ensures your dataset remains comprehensive and reliable. You can fill gaps using techniques like imputation or by collecting additional information from the source.
Key Insight: Identifying and addressing missing data early prevents biased analysis and ensures your insights remain trustworthy.
Detect Inconsistent or Conflicting Data
Inconsistent or conflicting data arises when the same information is recorded differently or contradicts itself. For example, one record might list a state as "NY," while another spells it out as "New York." Conflicting data, such as two different birthdates for the same individual, can further complicate your analysis.
To detect inconsistencies:
Standardize Formats: Ensure uniformity in how data is entered. For instance, use consistent date formats or abbreviations.
Compare Related Fields: Cross-check fields that should align. For example, verify that ZIP codes match their corresponding city and state.
Leverage Validation Rules: Use tools that enforce data entry standards, such as dropdown menus or predefined formats.
Pro Tip: Standardizing data entry processes reduces inconsistencies and ensures your dataset remains clean and actionable.
By following these steps, you can systematically identify dirty data in your dataset. This proactive approach safeguards the integrity of your analysis and helps you make informed decisions.
Spot Outliers and Anomalies
Outliers and anomalies are data points that deviate significantly from the rest of your dataset. These irregularities can distort your analysis and lead to unreliable conclusions. For example, a single transaction worth $1,000,000 in a dataset where most transactions range between $10 and $100 is an outlier. While some outliers may represent valid data, others often indicate errors or inconsistencies that require attention.
To identify outliers and anomalies effectively:
Visualize Your Data: Use scatter plots, box plots, or histograms to spot data points that fall outside the expected range. Visual tools make it easier to detect unusual patterns or extreme values.
Calculate Statistical Measures: Compute metrics like mean, median, and standard deviation. Data points that fall far beyond the standard deviation are likely outliers.
Apply Automated Detection Tools: Leverage software like Python’s Pandas library or machine learning algorithms designed for anomaly detection. These tools can quickly flag irregular data points for review.
Pro Tip: Investigate outliers before removing them. Some may represent valuable insights, such as identifying fraudulent transactions or discovering new trends.
By addressing outliers and anomalies, you ensure your dataset reflects accurate and consistent information. This step enhances the reliability of your analysis and prevents skewed results.
Validate Data Against Standards or Rules
Validating your data against predefined standards or rules ensures consistency and accuracy. This process involves checking whether your dataset adheres to specific formats, ranges, or logical relationships. For instance, a ZIP code should match its corresponding city and state, and dates should follow a uniform format.
To validate your data:
Define Clear Standards: Establish rules for data entry, such as acceptable date formats, numerical ranges, or text abbreviations. For example, use "CA" instead of "California" to maintain uniformity.
Use Validation Tools: Employ tools like Excel’s data validation feature or database constraints to enforce these rules during data entry. Automated validation reduces the risk of human error.
Cross-Check Related Fields: Ensure logical consistency between fields. For instance, verify that a customer’s age aligns with their birthdate or that product prices fall within expected ranges.
Key Insight: Consistent validation processes prevent errors from entering your dataset, saving time and effort during analysis.
By validating your data against standards or rules, you create a reliable foundation for decision-making. This practice minimizes errors and ensures your dataset remains clean and actionable.
Tools and Techniques to Identify Dirty Data
Identifying dirty data requires a combination of manual effort, automated tools, and advanced techniques. Each approach offers unique advantages, depending on the complexity and size of your dataset. Below, you’ll find practical methods to help you tackle dirty data effectively.
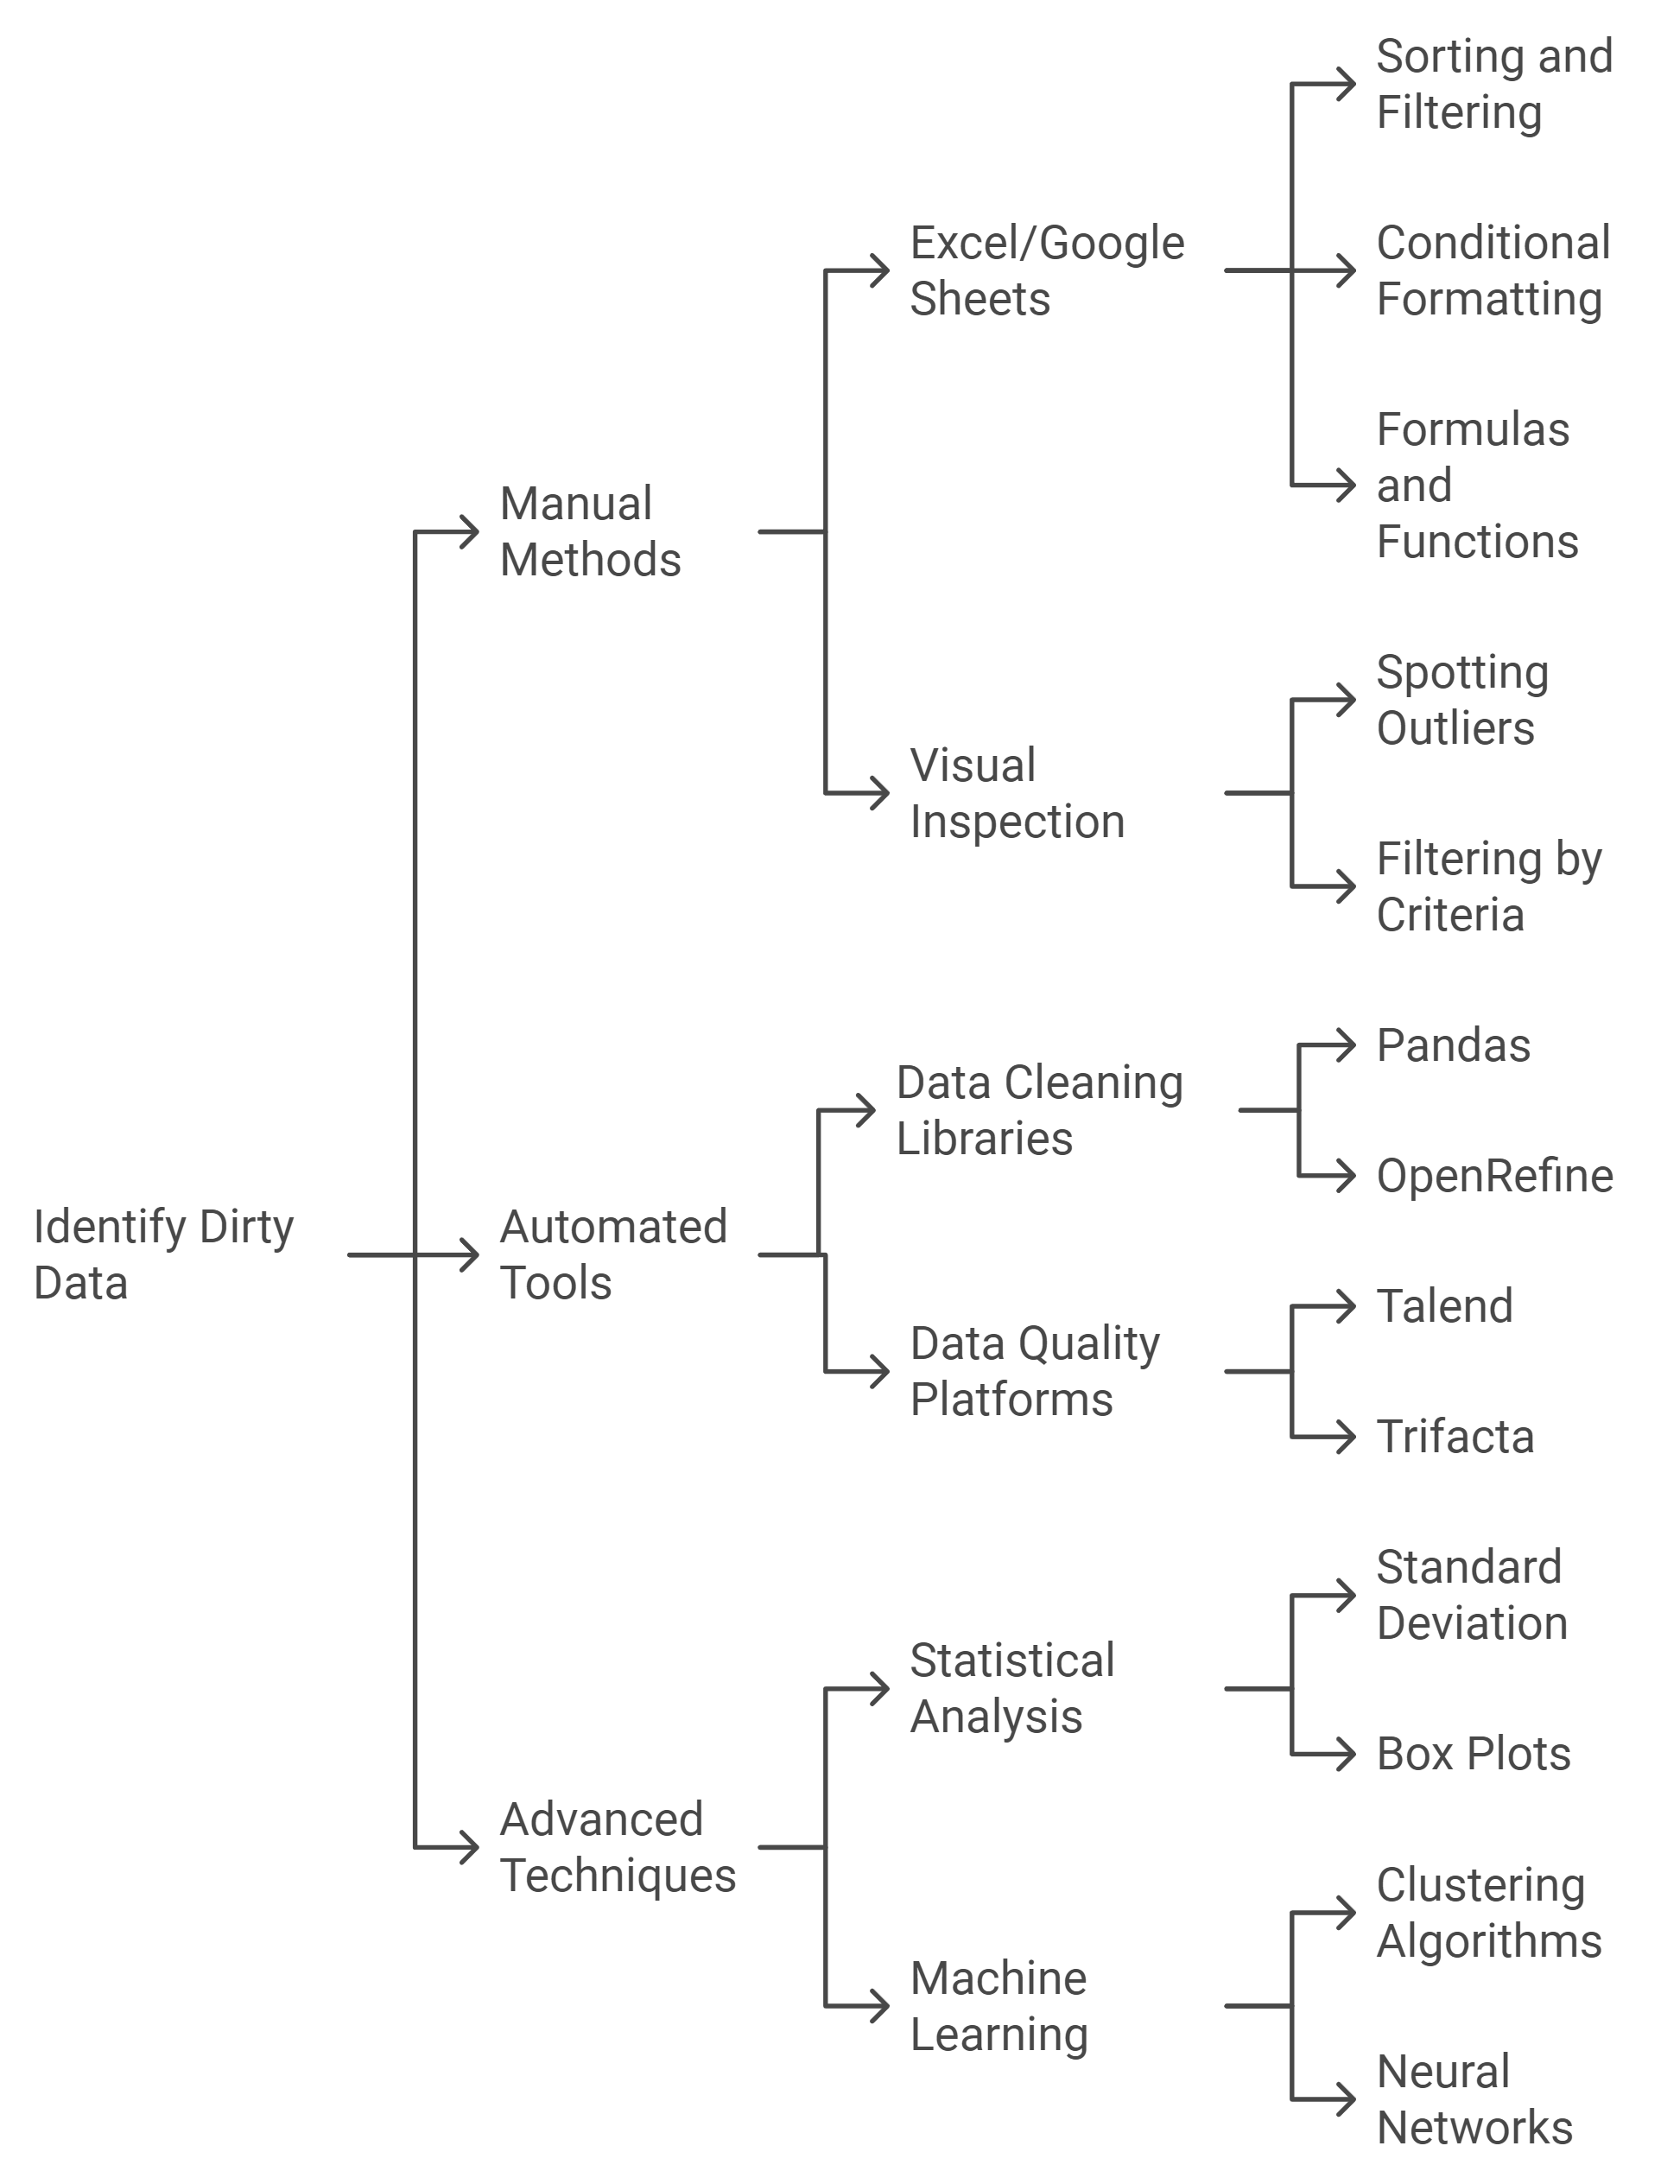
Manual Methods
Using Excel or Google Sheets
Excel and Google Sheets are excellent starting points for identifying dirty data in smaller datasets. These tools allow you to sort, filter, and visually inspect your data for errors.
Sorting and Filtering: Organize your data by specific columns to spot duplicates or inconsistencies. For example, sorting customer names alphabetically can reveal repeated entries with slight variations.
Conditional Formatting: Highlight missing values or outliers by applying color-coded rules. This makes it easier to pinpoint anomalies at a glance.
Formulas and Functions: Use built-in functions like
COUNTIFto detect duplicates orISBLANKto identify empty cells.
Pro Tip: While Excel and Google Sheets are user-friendly, they may not handle large datasets efficiently. For extensive data, consider automated tools.
Visual Inspection and Filtering
Visual inspection involves scanning your dataset for obvious errors, such as typos or outliers. Filtering helps narrow down specific subsets of data for closer examination.
Spotting Outliers: Look for values that deviate significantly from the norm. For instance, a salary entry of $1,000,000 in a dataset where most salaries range between $50,000 and $100,000 likely indicates an error.
Filtering by Criteria: Apply filters to isolate records with missing or inconsistent data. For example, filter rows where the "State" column is blank or contains unexpected abbreviations.
Key Insight: Manual methods are ideal for small datasets or when you need to understand the nature of your data before applying automated solutions.
Automated Tools
Data Cleaning Libraries (e.g., Pandas, OpenRefine)
Automated tools like Pandas and OpenRefine simplify the process of identifying and cleaning dirty data. These tools are particularly useful for handling large datasets.
Pandas: A Python library that allows you to programmatically detect duplicates, missing values, and inconsistencies. For example, the
drop_duplicates()function removes duplicate rows, whileisnull()identifies missing data.OpenRefine: A powerful tool for cleaning messy data. It enables you to cluster similar entries (e.g., "NY" and "New York") and standardize formats with ease.
Pro Tip: Automating repetitive tasks saves time and reduces human error, making these tools indispensable for data professionals.
Data Quality Platforms (e.g., Talend, Trifacta)
Data quality platforms offer advanced features for identifying and resolving dirty data. These tools integrate seamlessly with databases and provide real-time insights.
Talend: Detects duplicates, validates data against predefined rules, and ensures consistency across datasets.
Trifacta: Uses machine learning to suggest cleaning actions, such as merging similar records or filling missing values.
Key Insight: Data quality platforms are ideal for organizations that require scalable solutions to maintain clean and reliable datasets.
Advanced Techniques
Statistical Analysis for Outliers
Statistical methods help you identify outliers that could distort your analysis. These techniques are particularly effective for numerical data.
Standard Deviation: Calculate the mean and standard deviation of your dataset. Values that fall beyond three standard deviations from the mean are likely outliers.
Box Plots: Visualize your data to identify extreme values. Box plots highlight the interquartile range, making it easier to spot anomalies.
Pro Tip: Not all outliers are errors. Some may represent valuable insights, such as identifying fraudulent transactions or emerging trends.
Machine Learning for Anomaly Detection
Machine learning algorithms can automatically detect anomalies in complex datasets. These techniques are especially useful for large-scale or dynamic data.
Clustering Algorithms: Group similar data points together and flag those that don’t fit. For example, the k-means algorithm can identify unusual customer behavior in transaction data.
Neural Networks: Use deep learning models to detect patterns and anomalies. These models excel at identifying subtle irregularities that traditional methods might miss.
Key Insight: Machine learning provides a proactive approach to identifying dirty data, enabling you to address issues before they impact your analysis.
By combining manual methods, automated tools, and advanced techniques, you can effectively identify dirty data in your dataset. Each approach offers unique benefits, allowing you to choose the best method based on your specific needs.
Best Practices for Maintaining Clean Data
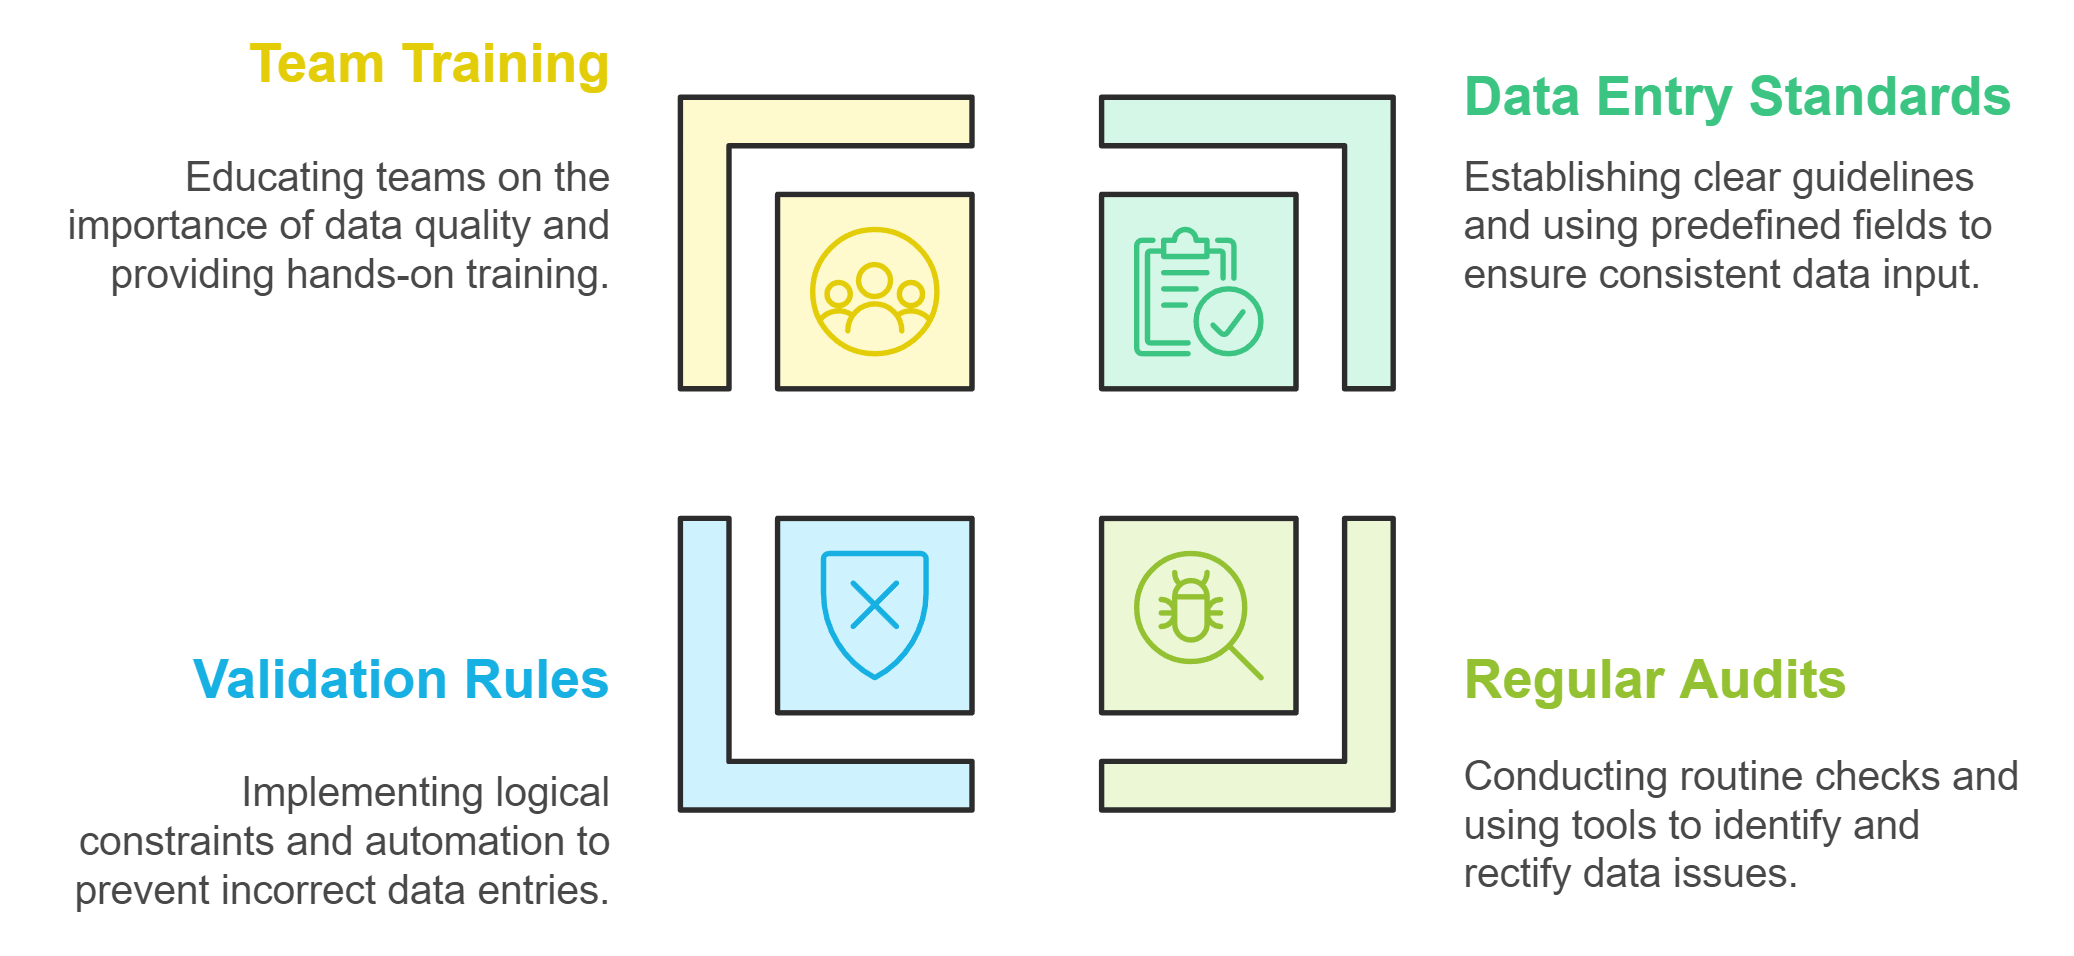
Maintaining clean data is essential for ensuring accurate analysis and reliable decision-making. By following these best practices, you can create a robust framework for managing your data effectively.
Establish Data Entry Standards
Setting clear data entry standards is the first step to maintaining clean data. When everyone follows consistent rules, errors and inconsistencies become less frequent.
Define Clear Guidelines: Specify acceptable formats for dates, names, and numerical values. For example, use "MM/DD/YYYY" for dates or standardize state abbreviations like "CA" for California.
Use Predefined Fields: Implement dropdown menus or checkboxes in data entry forms to minimize manual input errors.
Train Your Team: Educate employees on the importance of accurate data entry. Provide examples of common mistakes and how to avoid them.
Key Insight: Consistent data entry practices reduce the risk of errors and ensure that your dataset remains reliable from the start.
Regularly Audit and Clean Your Data
Even with the best standards, data can degrade over time. Regular audits help you identify and fix issues before they escalate.
Schedule Routine Checks: Set a timeline for reviewing your data, such as monthly or quarterly. Frequent audits prevent errors from accumulating.
Use Data Cleaning Tools: Leverage tools like OpenRefine or Pandas to automate the detection of duplicates, missing values, and inconsistencies. These tools simplify the cleaning process and save time.
Document Changes: Keep a record of the corrections made during each audit. This helps track recurring issues and improves future data management.
Pro Tip: Regular audits ensure your data stays accurate and actionable, reducing the risk of flawed analysis.
Use Data Validation Rules
Data validation rules act as a safeguard against incorrect entries. By enforcing these rules, you can catch errors at the point of entry.
Set Logical Constraints: Define rules that restrict data to specific ranges or formats. For instance, ensure that ZIP codes contain only five digits or that email addresses include "@" symbols.
Automate Validation: Use software features like Excel’s data validation or database constraints to enforce these rules automatically.
Cross-Check Related Fields: Validate relationships between fields. For example, verify that a customer’s age aligns with their birthdate or that product prices fall within expected ranges.
Key Insight: Validation rules act as a first line of defense, preventing errors from entering your dataset in the first place.
By implementing these best practices, you can maintain clean, reliable data that supports accurate analysis and informed decision-making.
Train Teams on Data Quality Importance
Your team plays a critical role in maintaining clean and reliable data. Without proper training, even the best tools and processes can fail to deliver accurate results. Educating your team about the importance of data quality ensures everyone understands their responsibility in preserving the integrity of your datasets.
Highlight the Impact of Dirty Data
Begin by explaining how dirty data affects decision-making, operational efficiency, and business outcomes. Use real-world examples to illustrate the consequences of errors, such as duplicate customer records leading to wasted marketing resources or missing values skewing survey results. When your team sees the tangible effects, they will grasp the importance of their role in maintaining data quality.Provide Hands-On Training
Equip your team with practical skills to identify and address data issues. Use tools like OpenRefine to demonstrate how to clean and transform messy datasets. Show them how to use clustering algorithms for deduplication or apply transformation expressions to standardize formats. Hands-on experience builds confidence and ensures your team can handle data challenges effectively.Establish Clear Guidelines
Create a set of data entry and validation standards for your team to follow. For example, specify acceptable formats for dates, numerical ranges, and text fields. Provide templates or predefined fields to minimize errors during data entry. Clear guidelines reduce inconsistencies and ensure everyone works toward the same quality standards.Encourage a Culture of Accountability
Foster a mindset where every team member feels responsible for data quality. Encourage them to double-check their work and report any issues they encounter. Recognize and reward efforts to maintain clean data. A culture of accountability motivates your team to prioritize accuracy and consistency in their tasks.
"Your insights and analysis are only as good as the data you are using," as experts emphasize. By training your team, you create a foundation for high-quality data that drives better decisions and outcomes.
Implement Automated Data Quality Monitoring
Manual data checks can be time-consuming and prone to human error. Automated monitoring tools streamline the process, ensuring your datasets remain clean and reliable without constant manual intervention. Implementing these tools saves time and enhances the accuracy of your data.
Choose the Right Tools
Select tools that align with your data needs. Platforms like Talend and Trifacta offer advanced features for real-time data quality monitoring. These tools detect duplicates, validate data against predefined rules, and flag inconsistencies automatically. Their integration with data lakes and warehouses ensures clean data flows seamlessly into your analysis phase.Set Up Validation Rules
Define rules that your data must meet to ensure accuracy. For instance, enforce constraints like valid email formats, numerical ranges, or consistent date formats. Automated tools can apply these rules across your dataset, catching errors at the point of entry or during processing.Monitor Key Metrics
Track metrics like the percentage of missing values, duplicate records, or inconsistent entries. Automated dashboards provide real-time insights into your data quality, helping you identify and address issues quickly. Regular monitoring ensures your data remains actionable and trustworthy.Leverage Machine Learning for Anomaly Detection
Use machine learning algorithms to identify patterns and anomalies in your data. For example, clustering algorithms can group similar records and flag outliers that deviate from the norm. These advanced techniques detect subtle irregularities that traditional methods might miss, enhancing the reliability of your datasets.
Key Insight: Automated monitoring tools not only save time but also reduce the risk of errors slipping through. They provide a proactive approach to maintaining data quality, allowing you to focus on analysis and decision-making.
By training your team and implementing automated monitoring, you create a robust framework for maintaining clean data. These steps ensure your datasets remain accurate, consistent, and ready for analysis, empowering you to make informed decisions with confidence.
Common Challenges in Identifying Dirty Data
Large Dataset Sizes
Handling large datasets presents a significant challenge when identifying dirty data. As the volume of data grows, spotting errors like duplicates, missing values, or inconsistencies becomes increasingly difficult. Manually reviewing millions of rows is impractical and time-consuming. Without the right tools, you risk overlooking critical issues that could compromise your analysis.
To address this challenge, you should rely on automated tools and techniques. Platforms like Talend or Python libraries such as Pandas can process large datasets efficiently. These tools help you detect duplicates, validate data, and flag anomalies without manual intervention. Additionally, visualizing data through charts or graphs can make patterns and outliers easier to identify, even in massive datasets.
Key Insight: Automating the identification process saves time and ensures accuracy, especially when working with large datasets. This approach allows you to focus on interpreting results rather than searching for errors.
Lack of Clear Data Standards
A lack of clear data standards often leads to inconsistencies and errors. When different team members or systems use varying formats for dates, names, or numerical values, the dataset becomes fragmented and unreliable. For example, one entry might list a state as "NY," while another spells it out as "New York." These inconsistencies complicate analysis and reduce the quality of insights.
To overcome this, you must establish and enforce data entry standards. Define clear rules for formatting, naming conventions, and required fields. For instance:
Use a consistent date format like MM/DD/YYYY.
Standardize abbreviations, such as "CA" for California.
Require mandatory fields, such as email addresses or phone numbers.
Training your team on these standards ensures everyone follows the same guidelines. Automated validation tools can also enforce these rules during data entry, reducing the likelihood of errors.
Pro Tip: Consistent data entry practices minimize confusion and enhance the reliability of your dataset. By standardizing inputs, you create a strong foundation for accurate analysis.
Limited Access to Tools or Expertise
Limited access to advanced tools or skilled professionals can hinder your ability to identify dirty data. Smaller organizations or teams may lack the budget for sophisticated platforms like Trifacta or the expertise to use programming libraries like Pandas. This limitation often forces reliance on manual methods, which are less efficient and more prone to errors.
To tackle this issue, start with accessible tools like Excel or Google Sheets. These platforms offer basic features such as sorting, filtering, and conditional formatting to help you identify duplicates, missing values, or outliers. For more advanced needs, consider free or open-source tools like OpenRefine, which provides powerful data cleaning capabilities without requiring extensive technical knowledge.
Investing in training can also bridge the expertise gap. Equip your team with the skills to use available tools effectively. Online courses, tutorials, and workshops can provide valuable knowledge at a low cost.
Key Insight: Even with limited resources, you can achieve clean data by leveraging accessible tools and building your team’s expertise. Start small and scale up as your needs and capabilities grow.
Balancing Speed and Accuracy in Data Cleaning
Balancing speed and accuracy in data cleaning is a challenge that requires thoughtful strategies. Rushing through the process may lead to overlooked errors, while excessive focus on perfection can delay critical decisions. To achieve the right balance, you need to adopt efficient methods without compromising the quality of your dataset.
1. Prioritize High-Impact Areas
Focus your efforts on the most critical parts of your dataset. Not all data holds equal importance, so identifying high-impact areas ensures your time is spent wisely. For example:
Key Customer Information: Ensure names, contact details, and purchase histories are accurate.
Financial Data: Validate transaction records and revenue figures to avoid costly mistakes.
Operational Metrics: Clean data that directly affects performance tracking or decision-making.
By prioritizing these areas, you can address the most significant issues first, ensuring your dataset remains reliable for essential tasks.
Pro Tip: Use a risk-based approach to identify which data errors could cause the most harm. This helps you allocate resources effectively.
2. Leverage Automation for Efficiency
Manual data cleaning can be time-consuming and prone to human error. Automation tools streamline the process, allowing you to clean large datasets quickly while maintaining accuracy. Consider these options:
Data Cleaning Libraries: Use Python’s Pandas library to detect duplicates, fill missing values, and standardize formats.
Data Quality Platforms: Tools like Talend and Trifacta automate validation and flag inconsistencies in real time.
Validation Rules: Implement automated checks to enforce data entry standards, such as ensuring ZIP codes match city names.
Automation reduces repetitive tasks, freeing up time for more complex data issues that require human judgment.
Key Insight: Automation doesn’t replace human oversight. Use it to handle routine tasks, but always review flagged errors to ensure accuracy.
3. Standardize Data Entry Processes
Standardization minimizes errors at the source, reducing the need for extensive cleaning later. Establish clear guidelines for data entry, such as:
Consistent date formats (e.g., MM/DD/YYYY).
Standardized abbreviations (e.g., "CA" for California).
Mandatory fields to prevent incomplete records.
Train your team to follow these standards and use tools like dropdown menus or predefined fields to enforce consistency. Standardization ensures uniformity across your dataset, making it easier to clean and analyze.
"Standardizing data at the point of entry saves time and ensures accuracy," as experts emphasize. This proactive approach reduces the burden of cleaning dirty data.
4. Set Realistic Goals for Cleaning
Perfection isn’t always necessary. Define clear objectives for your data cleaning efforts based on the intended use of your dataset. For instance:
If you’re preparing data for a quick report, focus on fixing glaring errors like duplicates or missing values.
For machine learning models, ensure the dataset is free from outliers and inconsistencies that could skew predictions.
Setting realistic goals helps you strike a balance between speed and accuracy, ensuring your dataset meets the requirements of its purpose.
Pro Tip: Avoid over-cleaning. Spending too much time on minor issues can delay your analysis without adding significant value.
5. Monitor and Adjust Your Approach
Data cleaning is an ongoing process. Regularly review your methods to identify areas for improvement. Track metrics like error rates, time spent on cleaning, and the accuracy of your final dataset. Use these insights to refine your approach and maintain a balance between speed and accuracy.
Key Insight: Continuous monitoring ensures your data cleaning process evolves with your needs, keeping it efficient and effective.
By prioritizing critical areas, leveraging automation, and standardizing processes, you can clean your data efficiently without sacrificing accuracy. This balanced approach ensures your dataset remains a reliable foundation for analysis and decision-making.
Real-World Examples of Dirty Data Issues
Case Study: Duplicate Records in Customer Databases
Duplicate records often create confusion and inflate metrics, leading to flawed business decisions. Imagine you manage a customer database for an e-commerce platform. A single customer might appear multiple times due to slight variations in their name or email address. For example, "John Smith" and "J. Smith" could represent the same individual. These duplicates can distort your customer count, skew sales data, and result in redundant marketing efforts.
To address this issue, you should implement a deduplication process. Start by identifying unique identifiers, such as email addresses or phone numbers. Use tools like OpenRefine or Python’s Pandas library to cluster similar entries and merge duplicates. Regularly auditing your database ensures that duplicate records do not accumulate over time.
Key Insight: Removing duplicates not only improves data accuracy but also enhances customer experience by preventing repeated communications or offers.
Case Study: Missing Data in Survey Results
Missing data can weaken the reliability of your analysis, especially in survey results. For instance, a survey on customer satisfaction might have incomplete responses for critical questions. If 30% of respondents skip a question about product quality, your insights will lack depth and may lead to biased conclusions.
To handle missing data, you can use several strategies:
Highlight Gaps: Use spreadsheet tools to identify blank fields. Conditional formatting can make these gaps more visible.
Impute Missing Values: Fill in missing data using statistical methods, such as calculating the mean or median for numerical fields. For categorical data, consider using the most frequent response.
Follow Up: Reach out to respondents to gather missing information, if feasible.
By addressing missing data, you ensure that your survey results remain comprehensive and actionable.
Pro Tip: Always analyze the pattern of missing data. Consistent gaps in specific questions or demographics might indicate a flaw in your survey design.
Case Study: Inconsistent Data in Financial Reports
Inconsistent data in financial reports can lead to serious errors in decision-making. For example, one department might record revenue in thousands (e.g., $10K), while another uses full figures (e.g., $10,000). These inconsistencies complicate financial analysis and may result in inaccurate forecasts or compliance issues.
To resolve this, you should standardize data formats across all departments. Define clear guidelines for recording financial figures, such as using a uniform currency format or decimal precision. Tools like Talend or Trifacta can automate the process of detecting and correcting inconsistencies. Additionally, training your team on data entry standards ensures long-term consistency.
Key Insight: Consistent financial data builds trust in your reports and supports accurate forecasting, budgeting, and compliance efforts.
By learning from these real-world examples, you can better understand the impact of dirty data and take proactive steps to address it. Each case highlights the importance of maintaining clean, reliable datasets for effective decision-making.
How to Prioritize Data Cleaning Efforts
Prioritizing your data cleaning efforts ensures you focus on what matters most. By targeting high-impact areas and aligning your actions with business objectives, you can maximize the value of your dataset while saving time and resources.
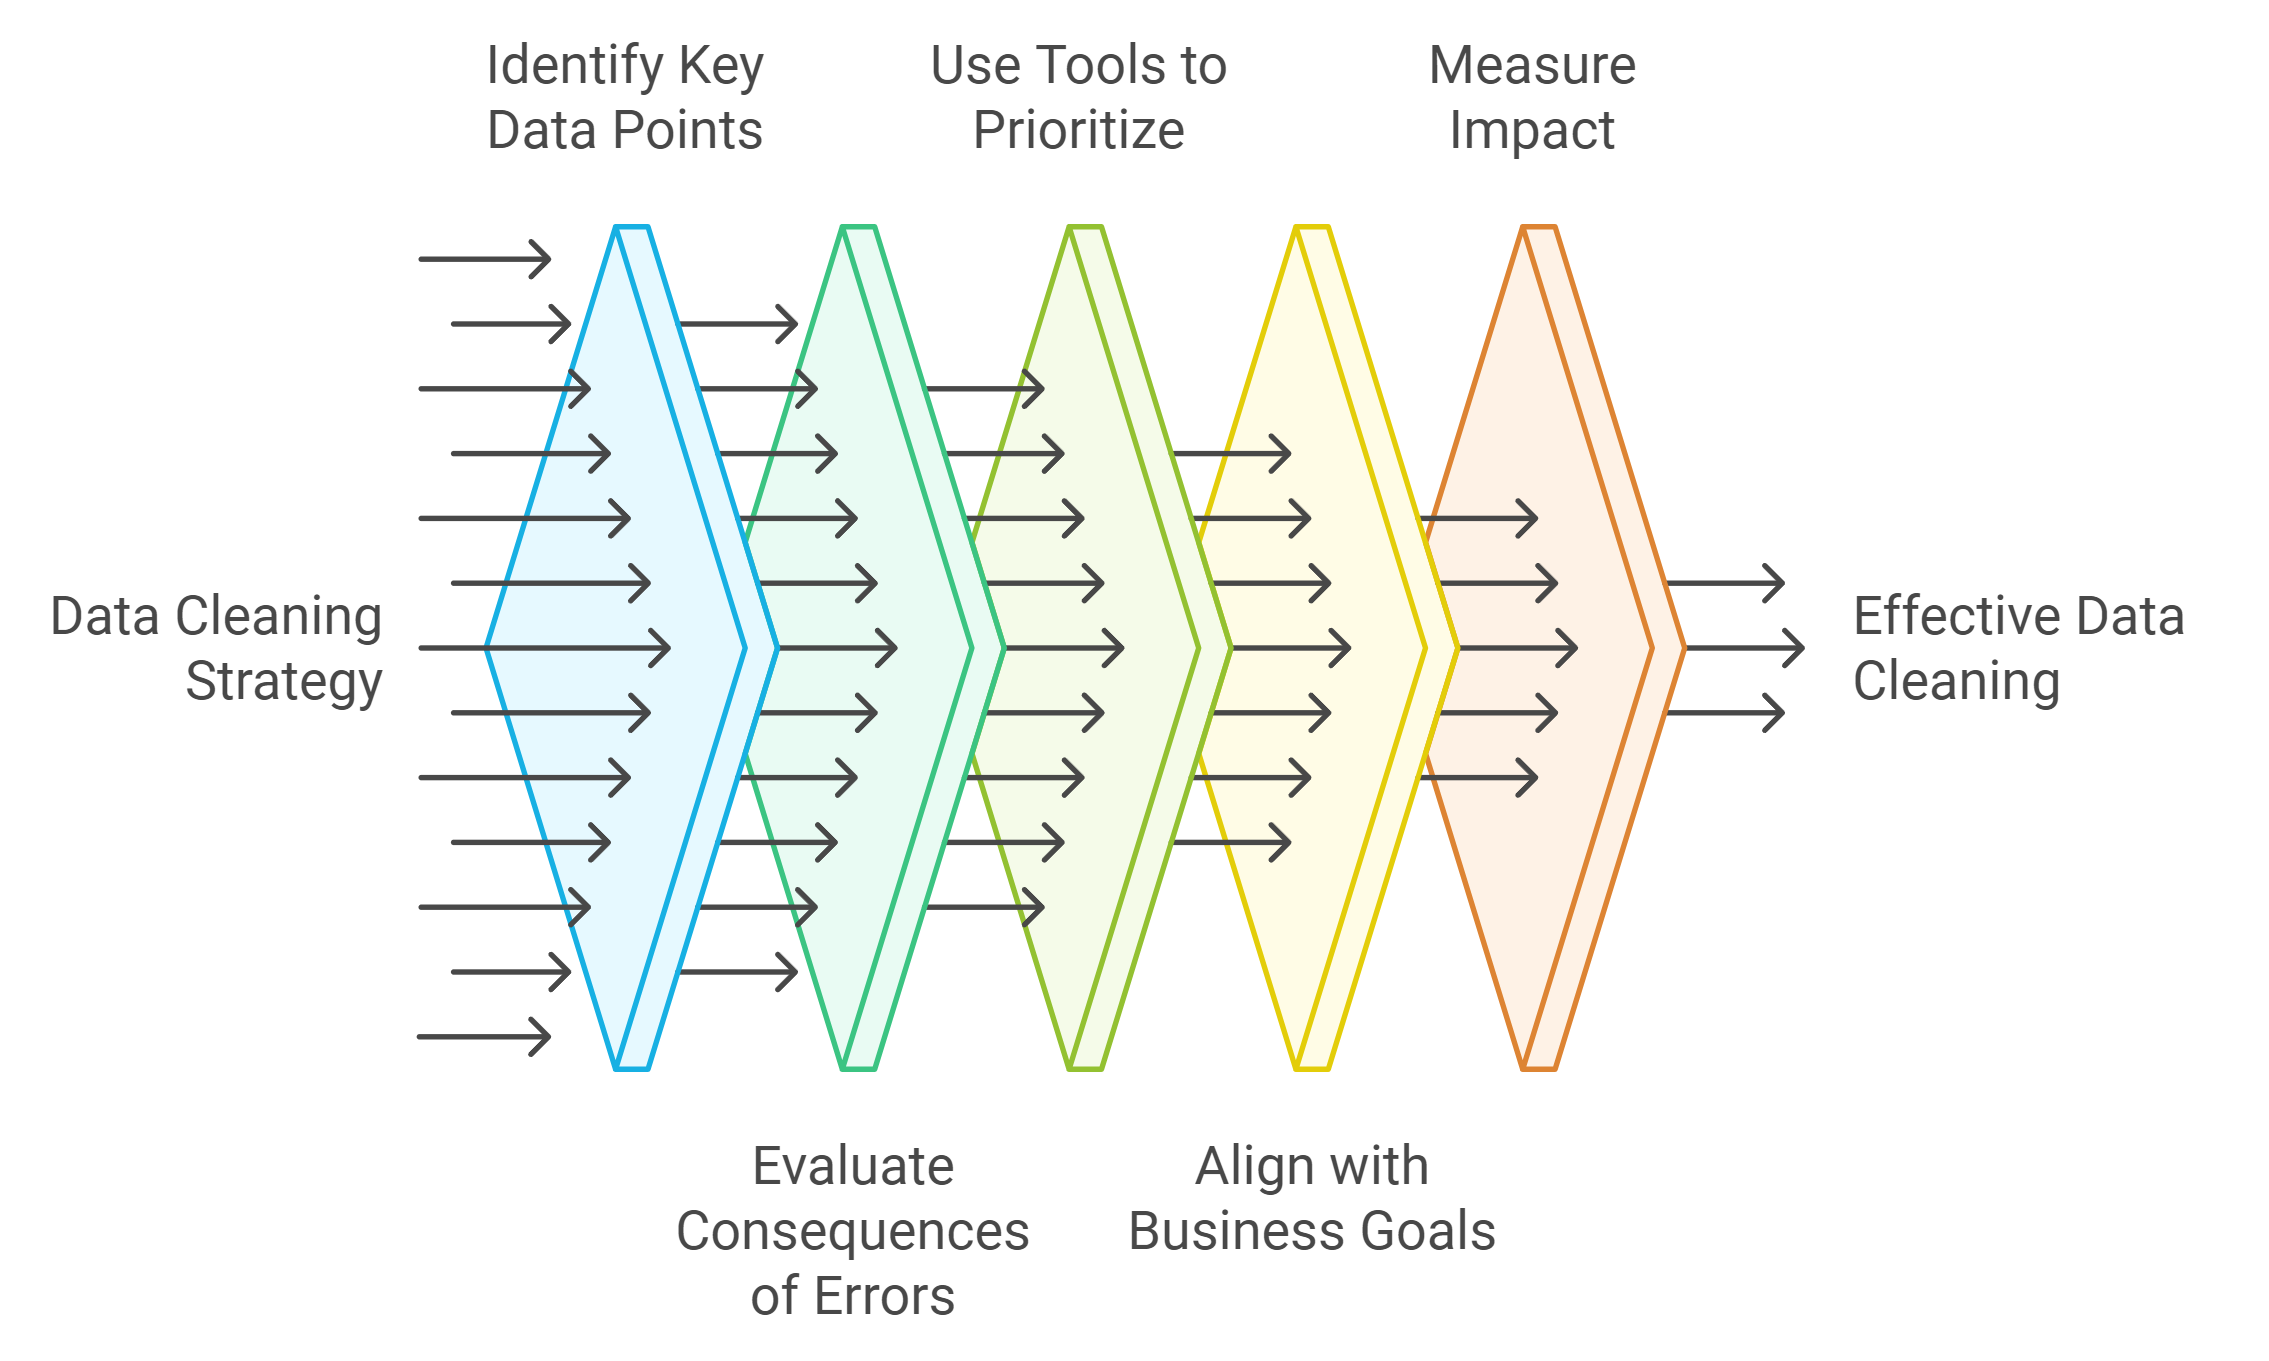
Focus on High-Impact Data First
Not all data holds the same level of importance. Some datasets directly influence critical decisions, while others play a supporting role. Identifying and addressing high-impact data first ensures your efforts yield the greatest benefits.
Identify Key Data Points
Pinpoint the data that drives your core operations. For example, customer contact details, financial records, and product inventories often hold the highest value. Errors in these areas can lead to missed opportunities or costly mistakes.Evaluate the Consequences of Errors
Assess how inaccuracies in specific datasets could affect your outcomes. For instance, duplicate customer records might inflate sales metrics, while inconsistent financial data could disrupt forecasting. Focus on cleaning the data that poses the greatest risks.Use Tools to Prioritize
Leverage tools like Pandas or Talend to analyze your dataset and identify areas with the most errors. These tools can highlight duplicates, missing values, and inconsistencies, helping you decide where to start.
Key Insight: Cleaning high-impact data first ensures your analysis remains accurate and actionable, even if time or resources are limited.
Align Cleaning Efforts with Business Goals
Your data cleaning strategy should align with your organization’s objectives. This approach ensures your efforts contribute directly to achieving measurable results.
Understand Your Goals
Define the purpose of your data. Are you improving customer segmentation, optimizing marketing campaigns, or enhancing operational efficiency? Knowing your goals helps you focus on cleaning the data that supports these initiatives.Collaborate with Stakeholders
Engage with teams that rely on the data. For example, marketing teams may need clean customer demographics, while finance teams require accurate revenue figures. Understanding their needs ensures your cleaning efforts address the right priorities.Measure the Impact
Track how clean data improves your outcomes. For instance, removing duplicates from a customer database might reduce redundant marketing emails, leading to higher engagement rates. Use these insights to refine your strategy and demonstrate the value of your efforts.
Pro Tip: Aligning your data cleaning efforts with business goals not only improves efficiency but also ensures your work delivers tangible benefits.
Use a Risk-Based Approach to Address Critical Issues
A risk-based approach helps you tackle the most pressing data issues first. By focusing on areas with the highest potential for harm, you can mitigate risks and maintain the integrity of your dataset.
Assess the Risks
Identify the risks associated with dirty data. For example, legacy systems often introduce format mismatches and synchronization problems, leading to inconsistencies. Similarly, a lack of validation mechanisms can create duplicate records, complicating analysis.Prioritize Based on Severity
Rank data issues by their potential impact. For instance, errors in financial reports might lead to compliance violations, while missing customer data could hinder sales efforts. Address the most severe issues first to minimize disruptions.Implement Preventative Measures
Use tools and processes to prevent future issues. For example, enforce data validation rules to reduce duplicates and inconsistencies. Regular audits can also help you catch problems early, ensuring your dataset remains clean over time.
Key Insight: A risk-based approach ensures you allocate resources effectively, addressing critical issues before they escalate.
By focusing on high-impact data, aligning your efforts with business goals, and adopting a risk-based approach, you can prioritize your data cleaning efforts effectively. This strategy ensures your dataset remains a reliable foundation for decision-making and analysis.
The Role of Data Cleaning in Long-Term Data Quality
Importance of Keeping Original Raw Datasets
Keeping your original raw datasets intact is a critical step in maintaining long-term data quality. These raw datasets act as a reference point, allowing you to revisit and verify your data cleaning efforts. Without them, you risk losing valuable information during the cleaning process.
Preserve Data Integrity: Original datasets ensure that you can compare cleaned data with its initial state. This helps you identify errors introduced during cleaning and avoid over-cleaning, which might remove useful information.
Enable Reanalysis: As business needs evolve, you may need to reanalyze your data using different methods or tools. Raw datasets provide the flexibility to adapt to new requirements without starting from scratch.
Support Transparency: Maintaining raw data builds trust in your analysis. Stakeholders can review the original data to understand how conclusions were drawn, ensuring accountability.
"Your raw data is your safety net. It allows you to correct mistakes and adapt to changing needs without compromising data quality."
By safeguarding your raw datasets, you create a foundation for consistent and reliable data management.
Benefits of Proactive Data Quality Management
Proactive data quality management involves addressing potential issues before they impact your operations. This approach saves time, reduces costs, and enhances the overall reliability of your data.
Prevent Costly Errors: Bad data costs businesses millions annually. Duplicate records, missing values, and inconsistencies can lead to flawed decisions and wasted resources. Proactively managing data quality minimizes these risks.
Improve Operational Efficiency: Clean data streamlines workflows. Employees spend less time fixing errors and more time focusing on strategic tasks. For example, accurate customer data improves segmentation and lead generation, boosting marketing efficiency.
Enhance Customer Relationships: Reliable data strengthens customer trust. Accurate records ensure personalized communication and prevent errors like duplicate emails or incorrect billing information. According to surveys, bad data negatively impacts customer relationships for nearly half of businesses.
Key Insight: Proactive data quality management is not just a technical task. It is a strategic investment that drives better outcomes across all areas of your business.
By adopting a proactive approach, you ensure that your data remains a valuable asset rather than a liability.
How Clean Data Enhances Business Outcomes
Clean data directly contributes to better business outcomes by improving decision-making, operational efficiency, and customer satisfaction. When your data is accurate and reliable, you can unlock its full potential.
Drive Informed Decisions: Clean data provides a solid foundation for analysis. It ensures that your insights are based on facts, not errors. For instance, accurate sales data helps you forecast demand and allocate resources effectively.
Boost Financial Performance: Reliable data reduces waste and optimizes spending. For example, removing duplicate customer records prevents redundant marketing efforts, saving money and improving ROI.
Strengthen Competitive Advantage: Clean data allows you to identify trends, track market changes, and respond quickly. Businesses with high-quality data gain a strategic edge, staying ahead of competitors.
Enhance Customer Experience: Accurate data enables personalized interactions. Customers receive relevant offers, timely updates, and error-free service, increasing loyalty and satisfaction.
"Clean data is the backbone of successful businesses. It empowers you to make smarter decisions, improve efficiency, and deliver exceptional customer experiences."
By prioritizing data cleaning, you set the stage for long-term success and sustainable growth.
Identifying and addressing dirty data is essential for maintaining the accuracy and reliability of your dataset. By spotting issues like duplicates, missing values, and inconsistencies, you protect your analysis from errors that could lead to flawed decisions. Use practical steps such as validating data, leveraging tools like Pandas or OpenRefine, and applying automated monitoring to streamline the process. Ongoing data quality management ensures long-term success by preventing errors from accumulating. Take proactive steps today to clean your data and unlock its full potential for better insights and outcomes.
See Also
Uncovering The Harsh Reality Of Inaccurate Data
Gaining Expertise In Data Analytics From A Microsoft MVP
How Data Governance Ensures High Standards Of Data Quality
Fostering Accountability By Implementing Effective Data Governance