Mastering Microsoft Fabric with Nikola Ilic
Explore essential insights on Power BI and Microsoft Fabric as shared by Nikola Ilic, the Data Mozart, during a recent Livestream.
Imagine tuning into a live session and finding that the guest speaker, known as the "Data Mozart," not only plays the keys of data analytics but also composes the symphony of Microsoft Fabric. Just like Mozart transformed music into an art form, Nikola Illich is on a mission to harmonize data management using Power BI. Today, we’ll dive into his insights, tips, and a few storytelling gems that reverberate through the annals of data analytics.
Who is the Data Mozart?
Introduction to Nikola Illich's Background
Nikola Ilic is not just a name; he represents a unique blend of creativity and analytical expertise. With a background steeped in data analytics, he has carved a niche for himself in the tech industry. So, who exactly is this intriguing figure known as "Data Mozart"? Let’s dive in!
His Journey from Belgrade to Salzburg
Nikola’s journey started in Belgrade, where he first honed his skills in data interpretation and analytics. But this story takes a fascinating turn. He moved to Salzburg, a city renowned for its rich musical heritage and, notably, for its connection to Mozart. This shouldn’t just be a geographical shift. It’s a leap into a world where art meets science, shaping his future endeavors.
Origin of the "Data Mozart" Nickname
The nickname “Data Mozart” is not just a label; it’s a representation of his passion. He embraced this moniker to symbolize how he transforms data into symphonic insights. Just as Mozart brought together diverse musical elements to create masterpieces, Nikola does the same with data—a true conductor orchestrating every piece to tell a compelling story. Imagine data as musical notes, waiting for someone to bring them to life!
How the Title Reflects His Approach to Data Analytics
The title "Data Mozart" also illustrates his unique approach to data analytics. It emphasizes creativity coupled with technical proficiency. Data analysis isn’t just about numbers; it involves synthesizing information to uncover hidden patterns and insights. This artistic vision is particularly notable in today's complex data environment, where raw data can often feel overwhelming. Nikola's philosophy is simple yet profound: creativity unlocks the potential of data.
Role of Creativity in Data Management
But let’s not underestimate the role of creativity in data management. Why should we view data management solely as a technical endeavor? In fact, creativity can bring immense value. Think of it this way—data is like clay. Without an imaginative sculptor, that clay remains a shapeless mass. It's Nikola's creative touch that transforms plain datasets into valuable insights, making analytics feel less like a chore and more like a form of art.
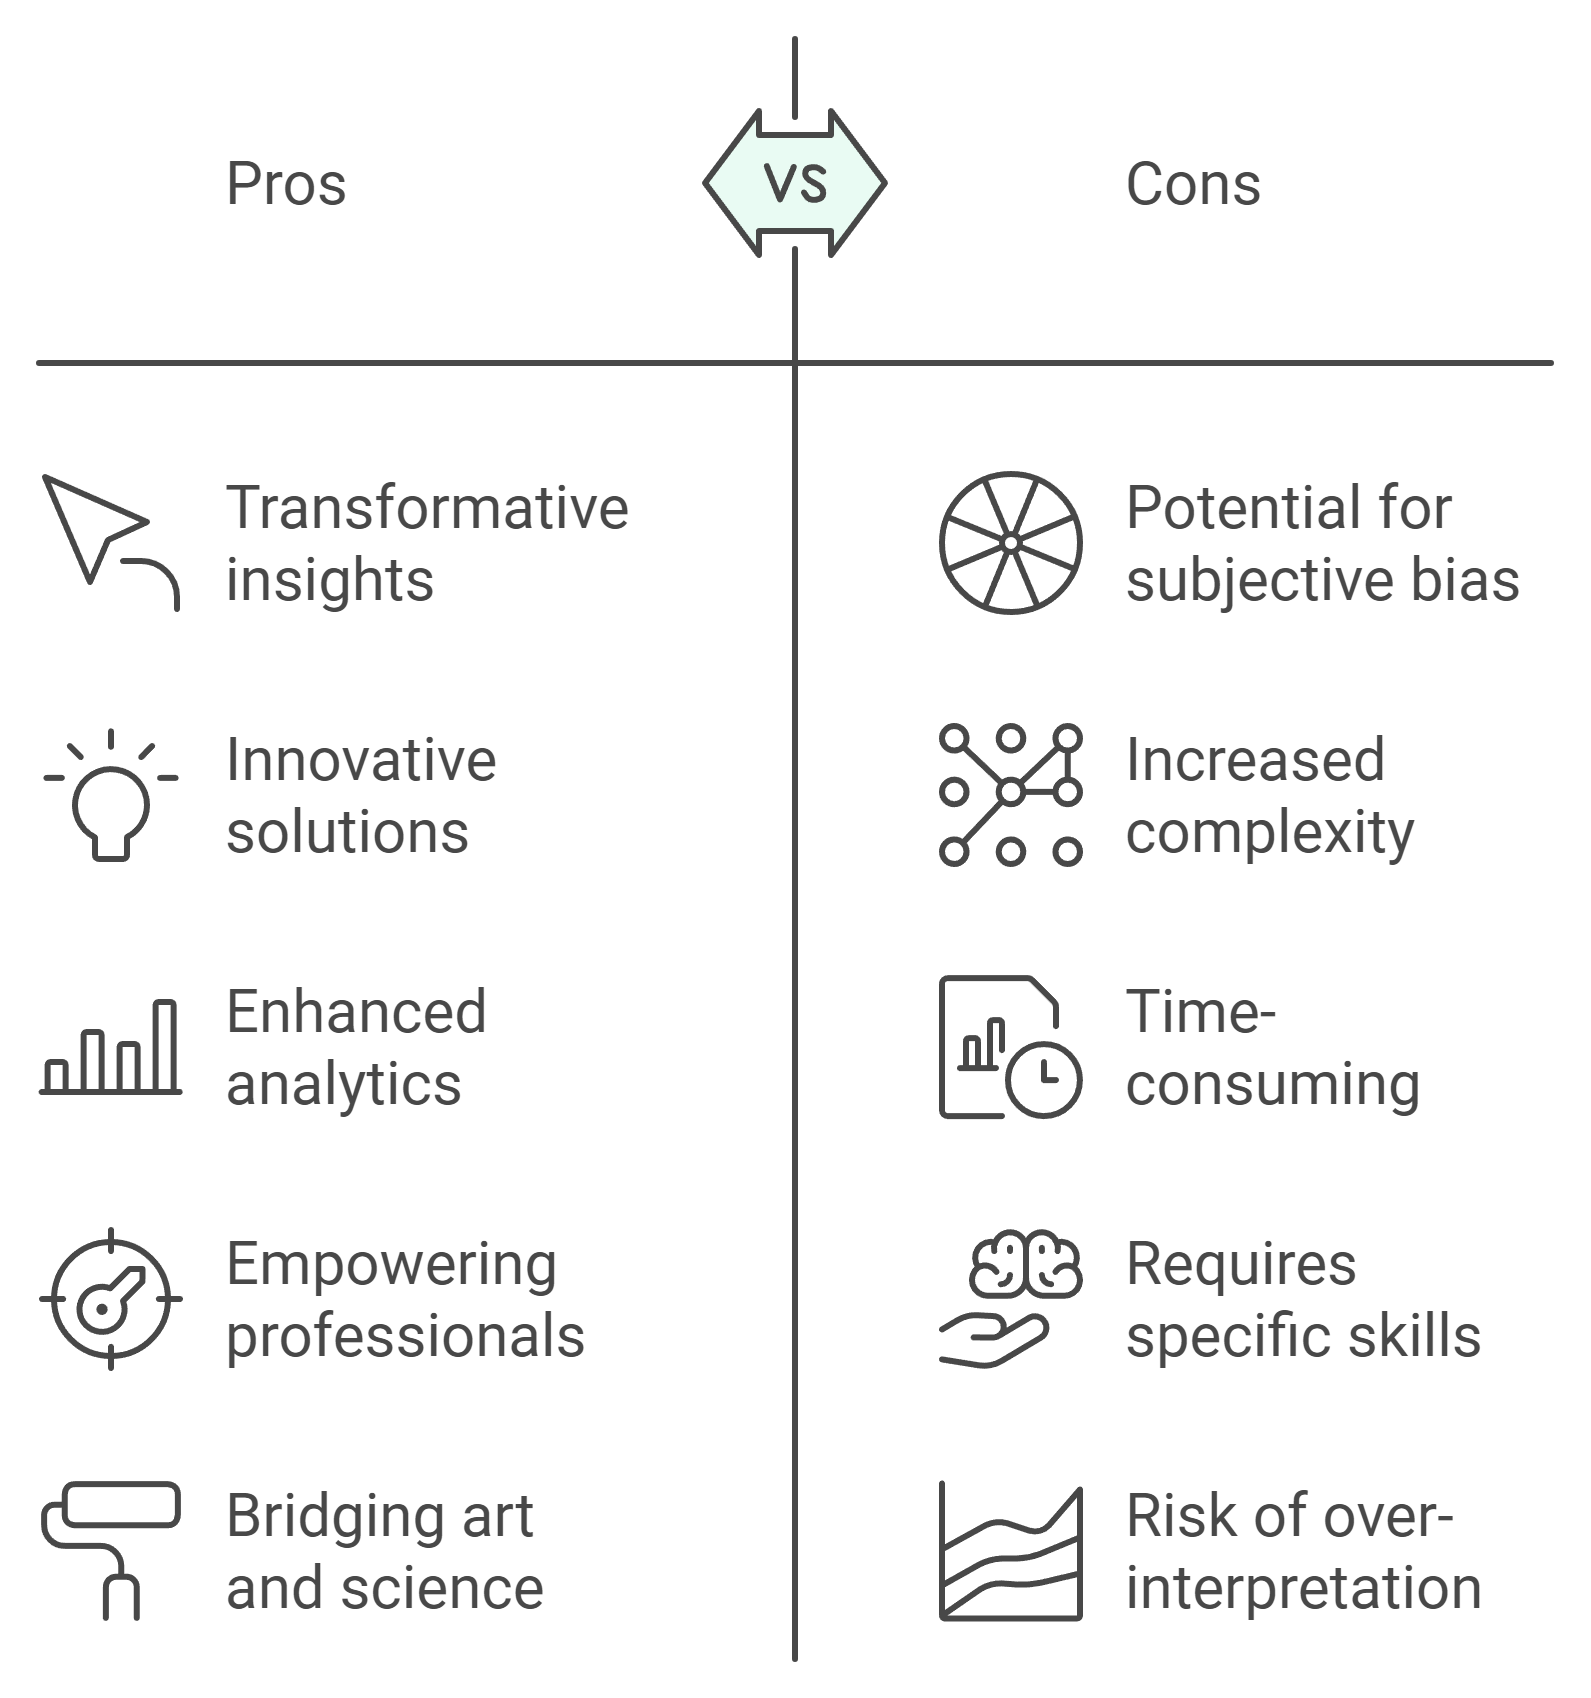
Transformative Approach: Nikola’s creative methodology revolutionizes how we interpret data.
Bridging Art and Science: By aligning analytical processes with creative insights, he highlights the importance of both.
Empowering Others: He inspires other analytics professionals to think outside the box and use creativity as a tool.
This philosophy not only enhances the analytics process but also opens doors to innovative solutions. It’s all about changing the way you think about data—from mere numbers to a rich tapestry of insights.
The Essence of Being a Data Mozart
In summation, Nikola Illich, or the Data Mozart, embodies a remarkable synthesis of creativity and analytical prowess. His journey speaks volumes about his commitment to pushing boundaries in data analytics. As you explore the world of data, consider channeling your inner Mozart. How can you blend creativity with analytical thinking? What symphonies can you create with data? Embrace the art of analytics, and you may just discover a new way to engage with your work.
Whether you are a data novice or an experienced analyst, there's something to learn from Nikola's story. You can ask yourself: how can embracing creativity change the way you approach your data challenges? The possibilities are endless.
Understanding Microsoft Fabric: The New Wave in Data Analytics
Microsoft Fabric has emerged as a comprehensive solution for modern data analytics. But what is it really? Let's break down its core functionalities and its significance in the world of data.
What is Microsoft Fabric?
Microsoft Fabric is an end-to-end analytics platform that combines multiple data sources, processing capabilities, and insightful outputs all in one environment. Launched in May 2023, it allows data professionals to utilize their existing knowledge of tools like Power BI while embracing new functionalities.
Think of Fabric as the conductor of an orchestra. Each instrument represents a different data source or tool, and Microsoft Fabric coordinates them into a harmonious output. This orchestration makes data analysis not only easier but also more efficient.
Core Functionalities of Microsoft Fabric
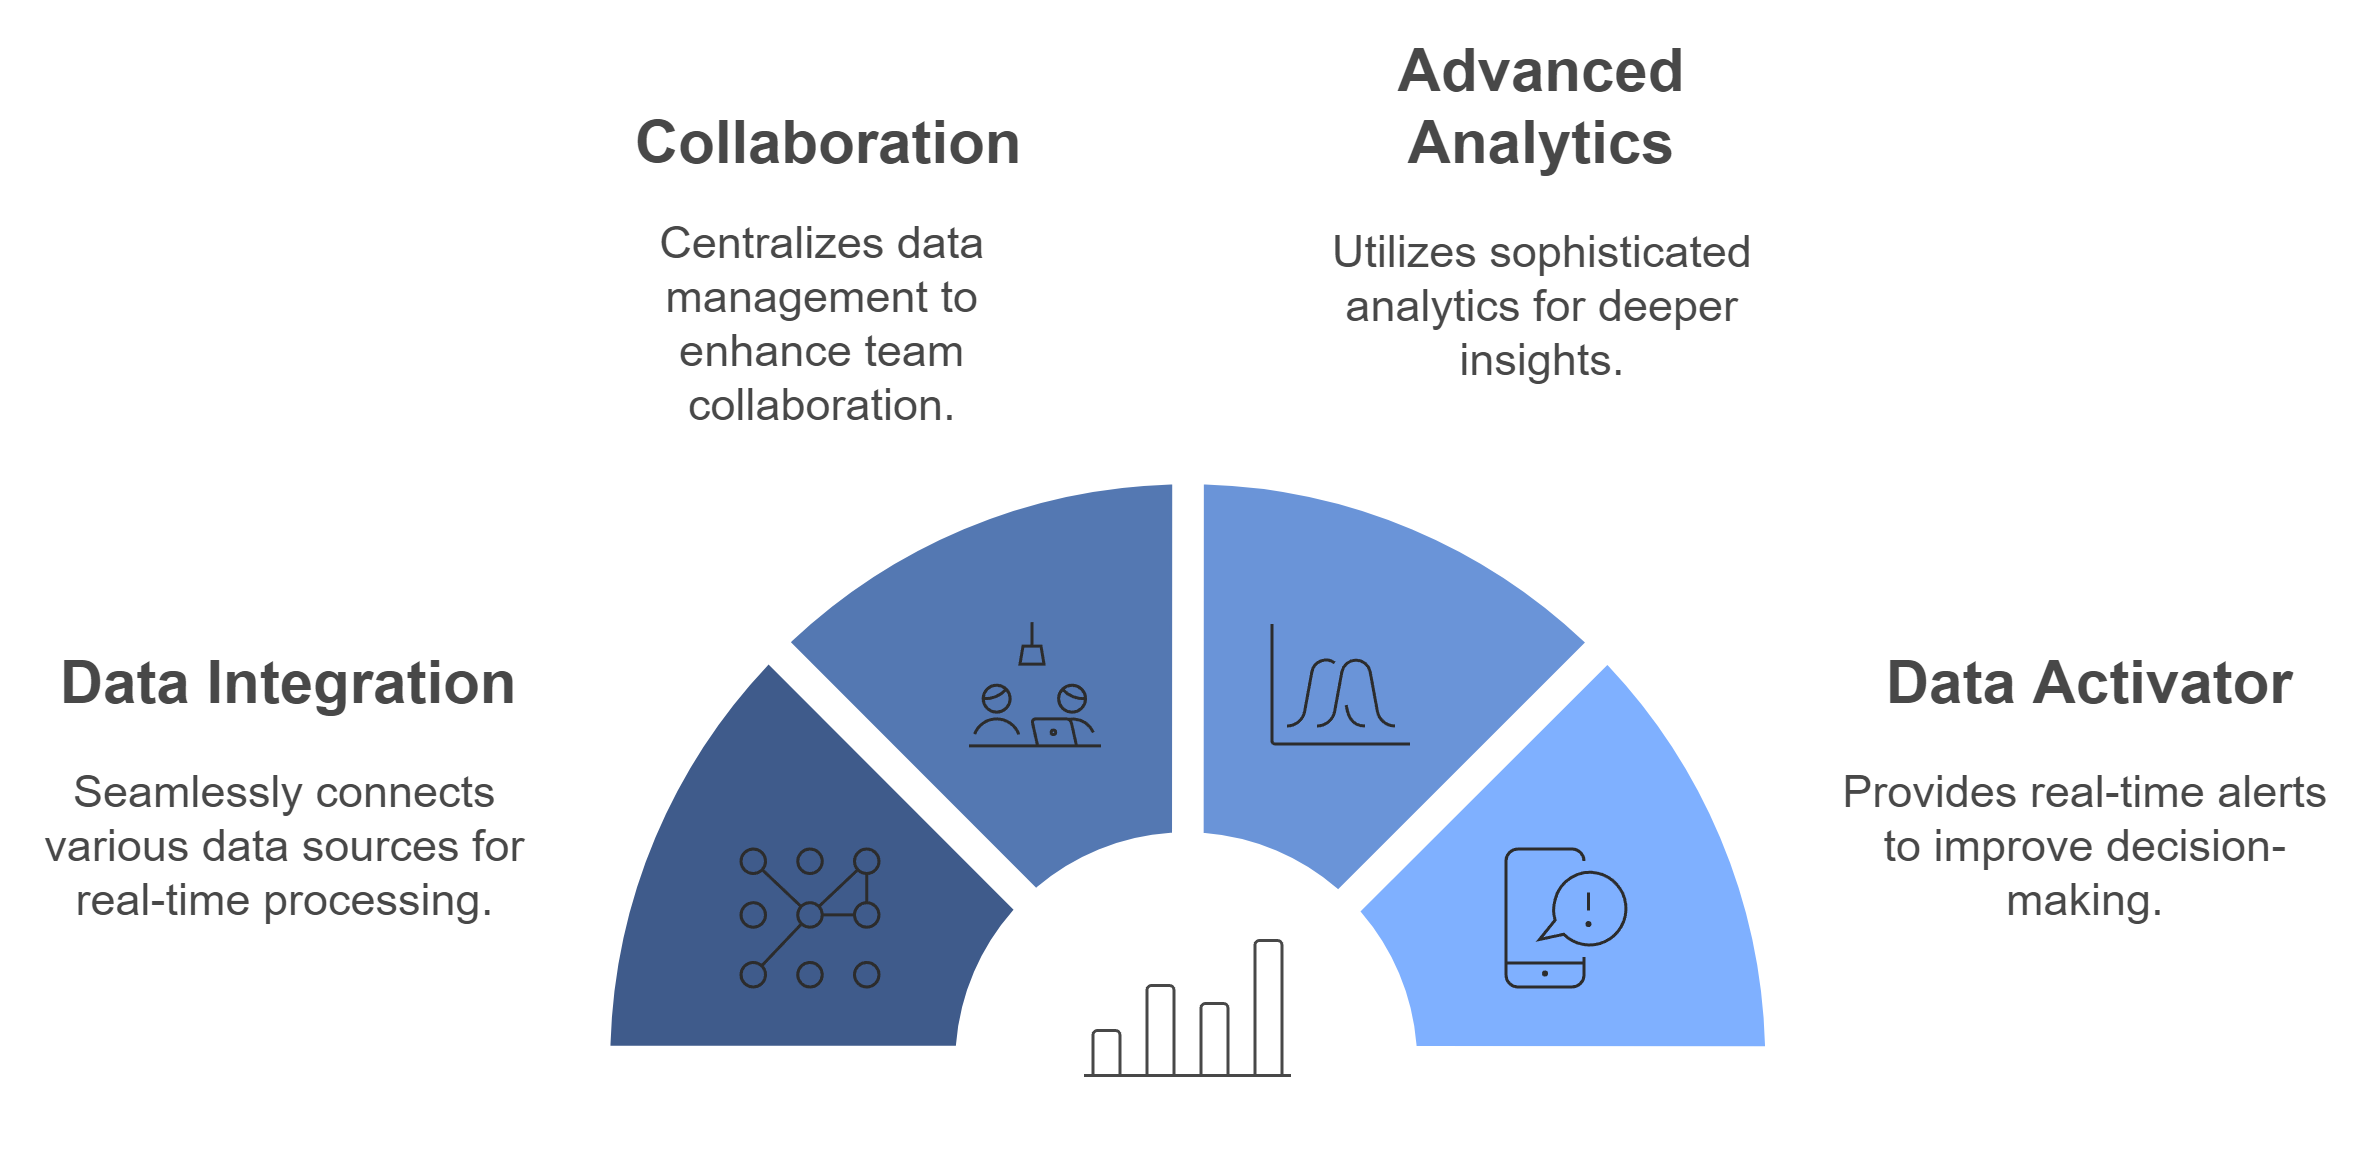
Data Integration: Fabric seamlessly connects various data sources, allowing for real-time data ingestion and processing.
Collaboration: By centralizing data management, teams can easily collaborate on analytics projects.
Advanced Analytics: Leverage sophisticated analytics capabilities to generate deeper insights.
Data Activator: This feature offers real-time alerts, enhancing decision-making processes.
The Significance of Fabric in Modern Analytics
In a world where data is produced at an exponential rate, tools like Microsoft Fabric are essential. Why? Because they simplify the entire analytics process. Organizations can now consolidate their data workflows into one platform, which minimizes complexity and promotes efficiency.
Imagine you're navigating a vast sea of data. Without Fabric, you're in a small boat with no compass. With it, you have a high-tech vessel equipped with GPS and navigation tools. You can explore confidently and reach your destination faster.
Integration with Existing Tools Like Power BI
Microsoft Fabric doesn't work in isolation. It integrates smoothly with existing tools like Power BI, allowing users to transition comfortably into this new landscape. This connection strengthens the capabilities of Power BI by enhancing data connectivity, storage options, and processing power.
Nikola Illich referred to this as a dual nature of Fabric. As a Power BI professional, it’s reassuring to know that the foundational knowledge of Power BI's architecture remains intact. You don’t have to worry about starting from scratch, and that’s a huge plus!
Overview of the Seven Workloads in Microsoft Fabric
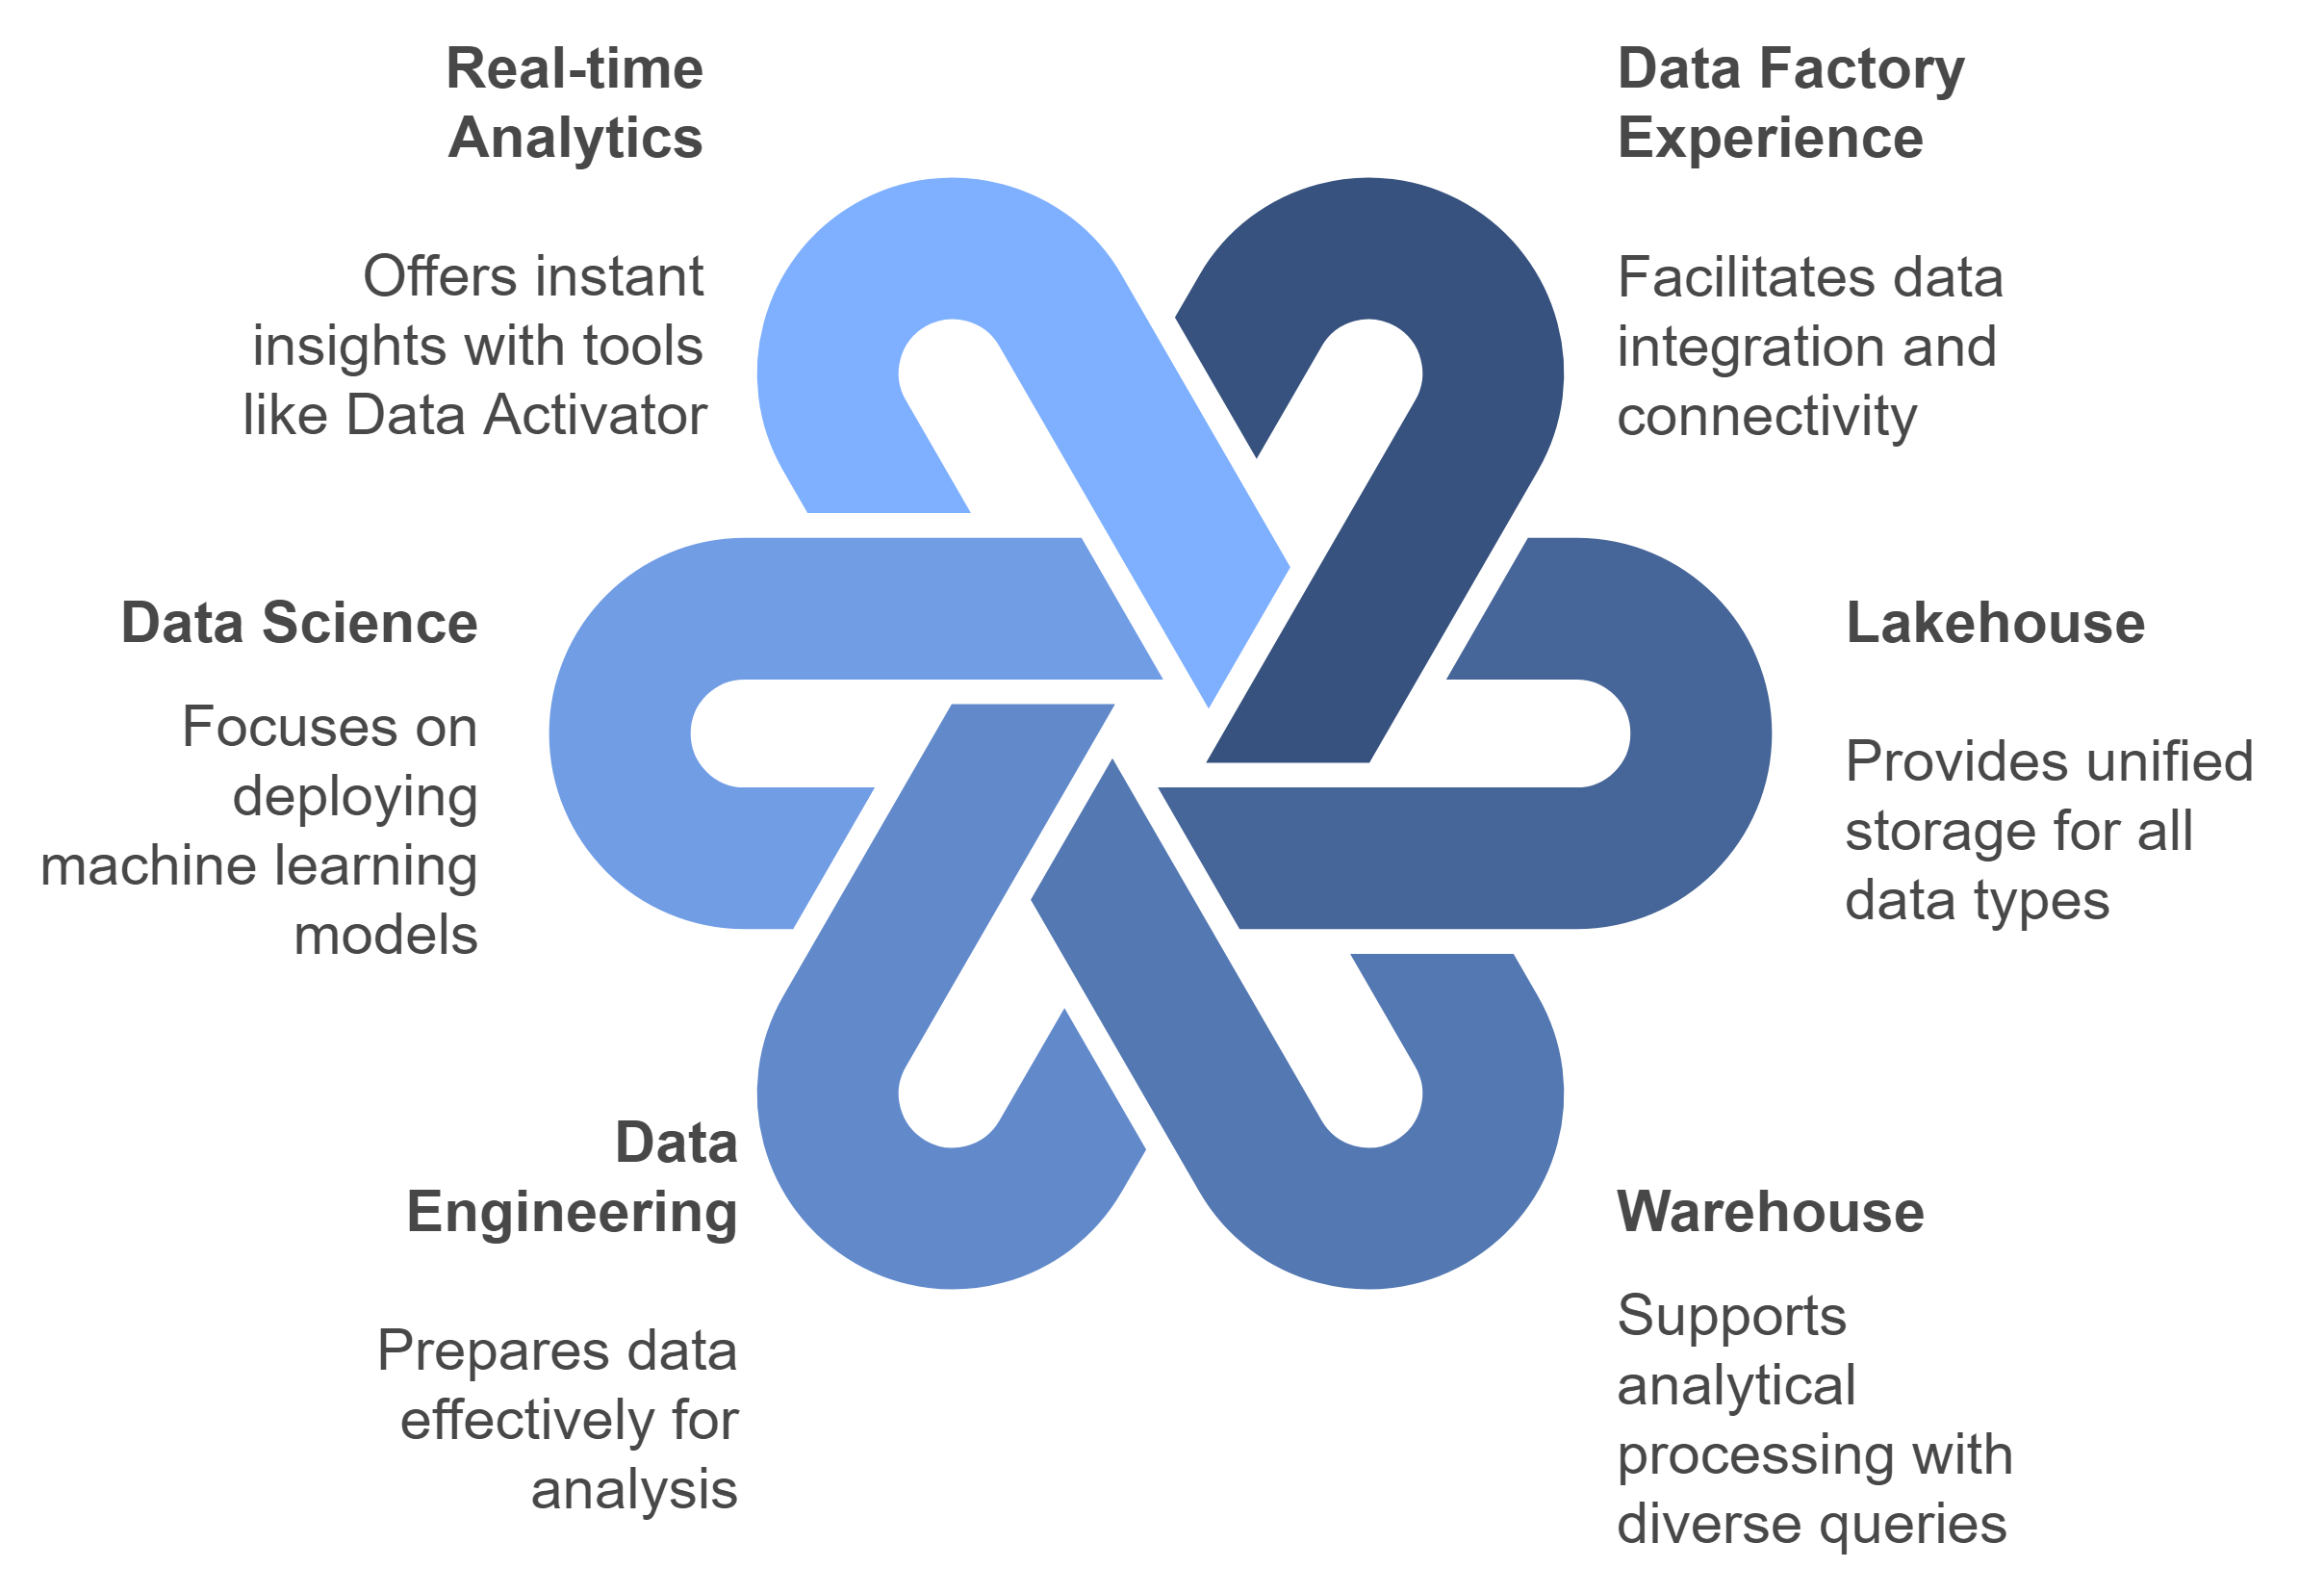
One of the standout features of Fabric is its seven specialized workloads. Each of these serves a unique purpose:
Data Factory Experience: For data integration and connectivity.
Lakehouse: A unified data storage solution for all forms of data—structured, semi-structured, and unstructured.
Warehouse: For analytical processing that supports a range of query types.
Data Engineering: Designed to prepare data for analysis effectively.
Data Science: For deploying machine learning models.
Real-time Analytics: This features capabilities like Data Activator for instant insights.
Power BI: The familiar visualization tool, now enhanced by Fabric.
When you explore each workload, you’ll find opportunities to tailor your data management strategies accordingly. It’s all about flexibility.
Real-world Implications for Data Professionals
The implications of Microsoft Fabric for data professionals are profound. With its comprehensive toolset, professionals can expect:
Streamlined Workflows: Spend less time on data preparation and more time on analysis.
Increased Collaboration: Work across teams to tackle complex data problems.
Enhanced Decision-Making: Access to real-time data leads to faster and more informed business decisions.
Scalability: As organizations grow, Fabric’s infrastructure can adapt with them.
In summary, Microsoft Fabric represents a transformative shift in the analytics landscape. For data professionals, it’s not just another tool; it’s a game changer that offers a depth of functionalities and capabilities. It's about enhancing your craft, providing deeper insights, and adding value to your organization.
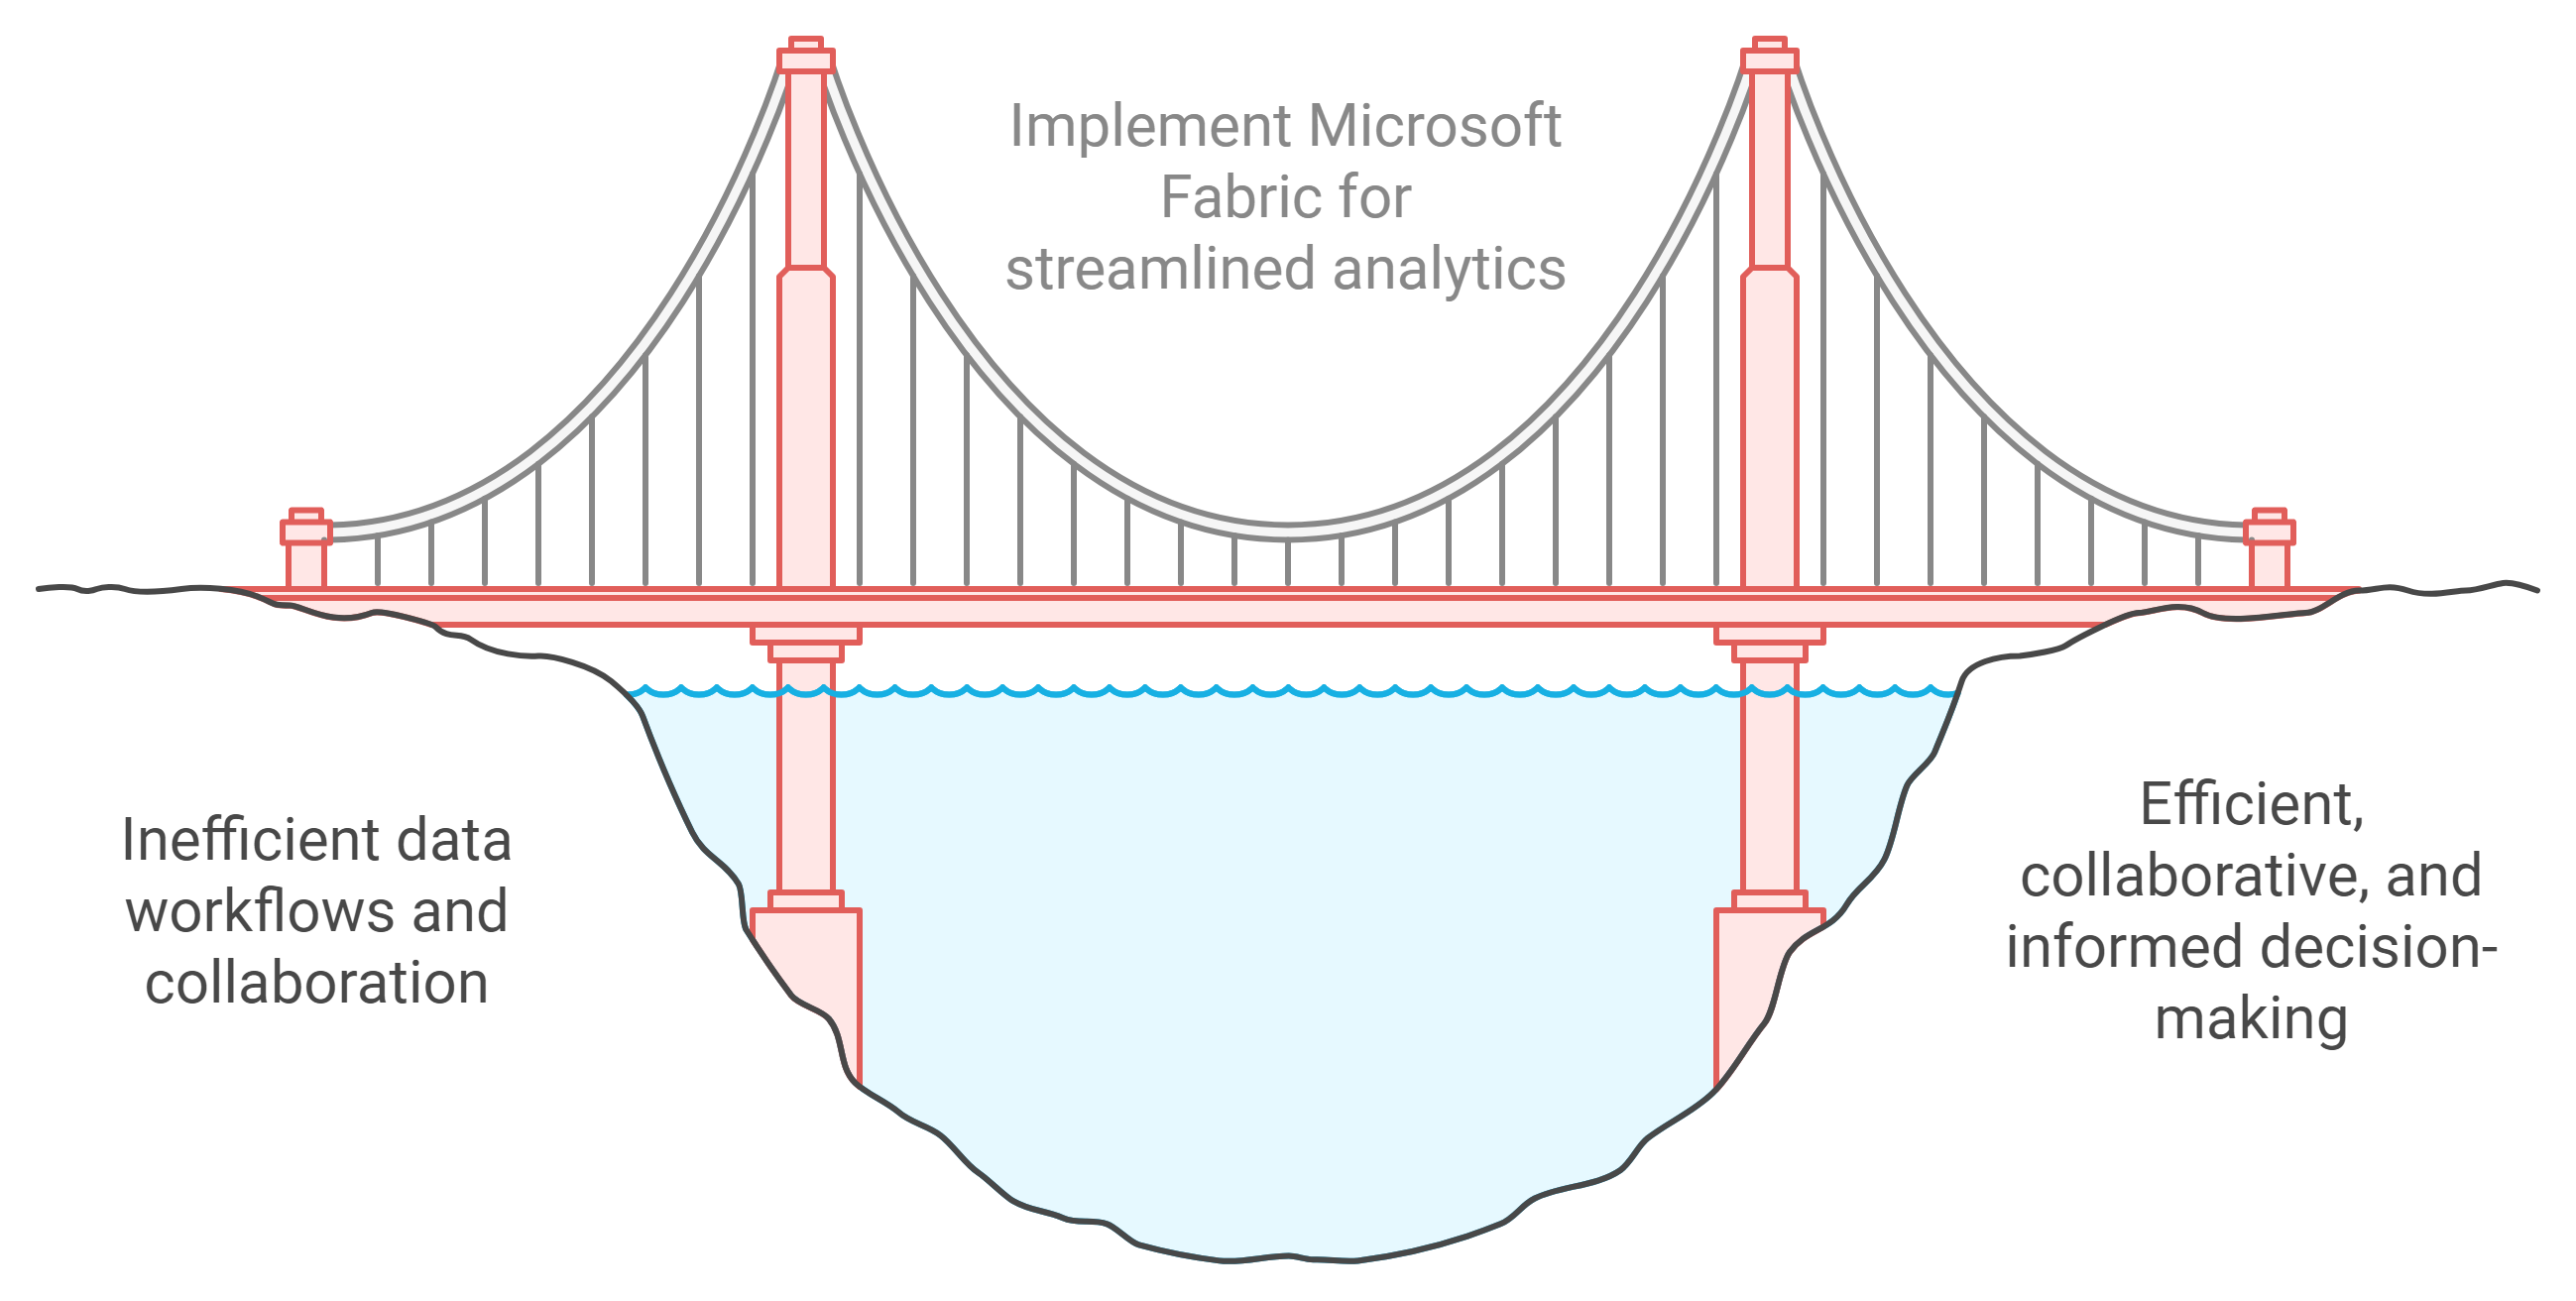
As you dive into this platform, remember that it complements existing tools rather than replacing them. Microsoft Fabric is here to elevate your data analytics experience.
Power BI Through the Lens of Microsoft Fabric
Survey of Changes and Similarities Between Power BI and Microsoft Fabric
Have you ever wondered how Microsoft Fabric builds upon the familiar grounds of Power BI? Well, you're not alone. As the digital landscape evolves, so do our tools for data analysis. Microsoft Fabric surfaced in May 2023 as a comprehensive end-to-end analytics platform that integrates various functionalities, including Power BI.
To begin with, let's identify a few key similarities. Power BI has always focused on transforming data into insights. With Microsoft Fabric, that goal remains firmly intact, but the approach is broader. Fabric offers an ecosystem that merges data ingestion, preparation, and analytics all in one.
But what about the changes? In essence, Fabric introduces new functionalities, such as the Data Factory Experience for enhanced data connectivity and a Lakehouse for storage. Traditional Power BI features are expanded, strengthening your possibilities for data reporting and visualization.
Detailed Explanation of Direct Lake Storage Mode
Now, let's dive into something you've probably heard of: Direct Lake storage mode. This is a novel feature introduced with Microsoft Fabric, and it’s worth taking note of.
Imagine a mode that combines the best of both worlds—offering the performance of Import Mode yet avoiding the common pitfalls associated with data duplication. That’s the essence of Direct Lake. It allows you to query data directly without needing to import it into your model. So, you get speed, and you preserve live connections to your source data.
To utilize Direct Lake, you'll need to store your data in delta format. This setup not only enables faster analytics but also aligns with the framework of Lakehouse and Warehouse concepts, enhancing efficiency in your reporting processes.
How to Leverage Existing Power BI Skills with Fabric
As a Power BI professional, you might be asking, “How can I leverage my existing skills with Fabric?” The good news? You’re already ahead of the game.
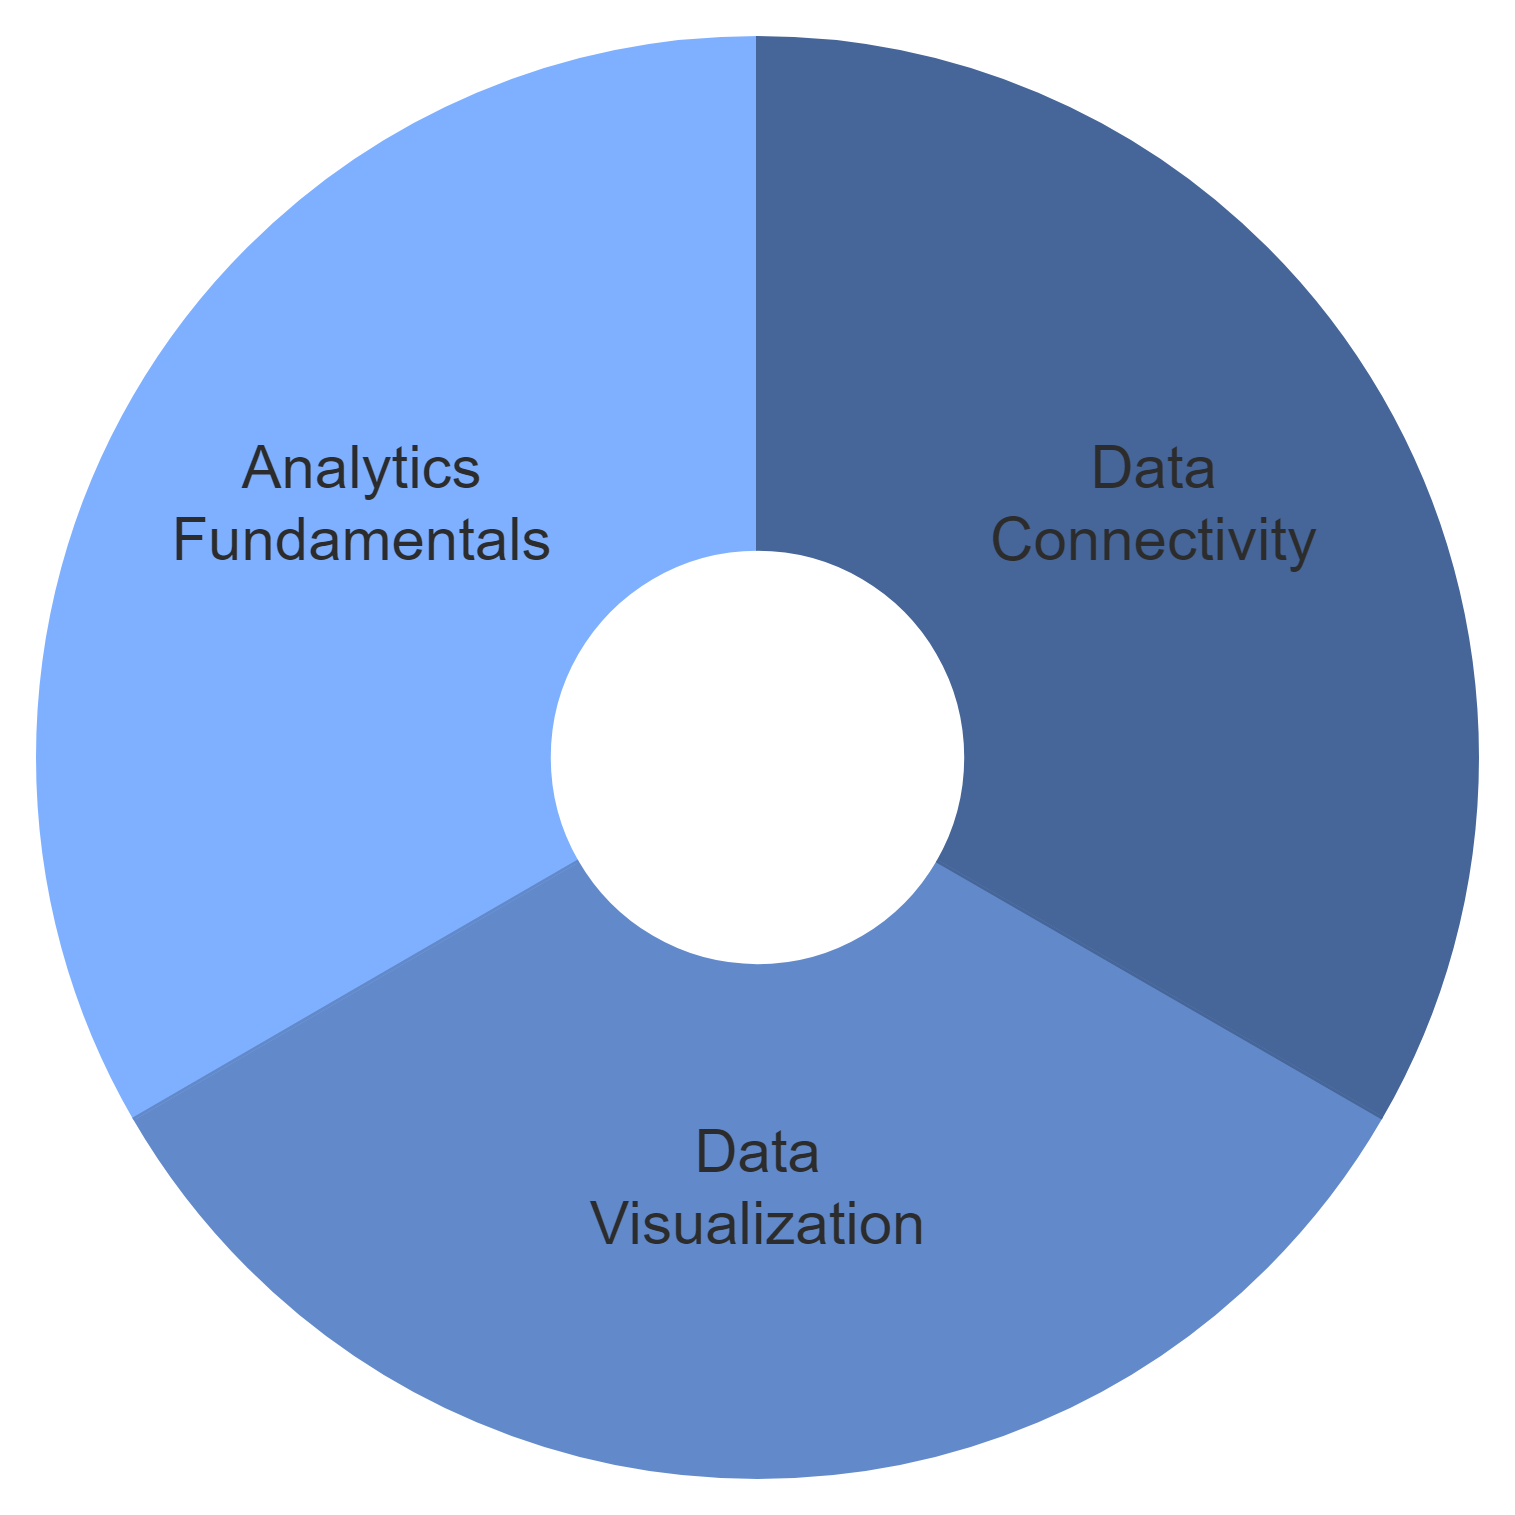
Many foundational concepts from Power BI remain relevant. The architecture you've learned won’t be discarded. Instead, think of Microsoft Fabric as a new layer that enhances your analytical capabilities.
Understanding data connectivity: Your knowledge of data sources translates well into Fabric.
Data visualization skills: Your proficiency in creating reports and dashboards with Power BI is invaluable in Fabric.
Fundamentals of analytics: Concepts around metrics and KPIs remain consistent.
By applying your existing skills within Fabric, you position yourself as an adaptable professional in the ever-evolving data landscape.
Importance of Continuous Education in the Data Field
This brings me to a crucial topic: the importance of continuous education in the data field. The world of data is fast-paced. New tools, technologies, and methodologies continuously emerge.
Committing to ongoing learning helps you stay relevant. You can tap into online courses, webinars, and community forums. Engage with experts and peers to broaden your understanding. For instance, during a recent discussion with “Data Mozart” Nikola Illic, the emphasis was on network learning and sharing experiences as pivotal for growth.
User Questions and Expert Answers on Transitioning to Fabric
Finally, let’s take a moment to address some questions from users about transitioning to Microsoft Fabric. Everyone has queries, and the expert responses can provide clarity.
Q: Is Fabric a total replacement for Power BI?
A: Not at all! Think of Fabric as an extension of Power BI, not a replacement. Power BI functionality is still relevant.Q: What about data integrity between Excel and Lakehouse?
A: It’s crucial to maintain consistency in data representation. Compatibility is a key focus in integration.Q: Should I migrate to Fabric right now?
A: It depends on your organizational needs. Analyze the benefits and decide strategically.
Engagement matters! Participating in these discussions helps you move forward in this dynamic field. Don’t hesitate to speak up, ask questions, and connect with others.
Ultimately, Microsoft Fabric not only enhances your existing capabilities but also paves the way for new possibilities in data analytics. The power is in your hands to adapt, learn, and thrive!
Live Q&A Insights: Engaging with the Audience
When it comes to exploring data analytics, engaging with the community can provide invaluable insights. In our latest Livestream featuring Nikola Illic, also known as the "Data Mozart," we delved deep into the world of Microsoft Fabric and Power BI. This session was laden with knowledge-sharing and lively discussions that highlighted popular queries and essential takeaways. Let’s break down what we learned!
Popular Queries from the Audience
It’s always enlightening to tune into what the audience is curious about. During the session, numerous viewers submitted questions, and the topics varied wide. Some common queries included:
How to optimize data retrieval using Direct Query versus Import Mode?
Differences between Lakehouse and data warehouse storage solutions?
Best practices for ensuring data integrity across various platforms?
These questions indicate a strong desire for clarity on how to leverage data management tools effectively. It’s a testament to how engaged the audience was in understanding the practical applications of Power BI and Fabric. Understanding these differences can help you make more informed decisions.
Expert Advice on Navigating Power BI and Fabric
Nikola provided some expert insights that are crucial for anyone working with these tools. One key piece of advice revolved around understanding Microsoft Fabric's dual nature—its various workloads and how they integrate. He explained:
"Microsoft Fabric isn’t just a one-stop solution; it’s a comprehensive analytics platform that brings together data processing and visualization."
This clarity is essential as you transition your workflow into using Fabric alongside Power BI. Nikola highlighted the importance of knowing your data architecture. He assured viewers that the foundational knowledge of Power BI still stands strong, even with the introduction of Microsoft Fabric. Embracing this knowledge equips you to leverage its capabilities more effectively.
Key Takeaways from Real-World Applications
What stood out during the Livestream were the real-world applications shared by attendees. Many participants brought to light their experiences using Microsoft Fabric in their organizations. Here are some key takeaways:
Utilizing Direct Lake for best performance while avoiding data duplication.
Creating custom semantic models to enhance reporting capabilities in Power BI.
Employing diagnostic tools like Performance Analyzer to troubleshoot slow DAX queries.
Such practical advice helps bridge the gap between theory and practice, allowing you to apply these insights directly to your work. The community aspect of learning from one another cannot be overstated.
Common Pitfalls and Best Practices
Even seasoned data professionals run into hurdles. During the Q&A, several common pitfalls arose. Here’s what you should watch out for:
Overlooking data integrity, especially when transitioning between platforms.
Neglecting performance optimization strategies for complex queries.
Relying solely on default semantic models for reporting.
Best practices discussed in this session reinforced the need to:
- Continuously monitor your data’s performance and integrity. - Customize your models based on organizational requirements. - Maintain a balance between traditional models and new functionalities.
Emphasizing Community Learning in the Data Space
One standout aspect from the Livestream was the strong emphasis on community learning. The audience was encouraged to share thoughts and connect with one another. It's essential to foster a sense of belonging in the data analytics community. Networking can make a significant difference in your career.
Nikola’s suggestion to share LinkedIn profiles in the chat for networking was a fantastic idea, promoting collaboration beyond just the session. Remember, you’re not alone in this journey; there are many others navigating similar paths.
Engaging with a community in the data space not only enriches your learning experience but also fosters a collaborative environment where everyone can thrive. So, whether it's through live Q&As or networking events, stay connected. It’s your journey, and the community is here to support you!
The Future of Data Analytics: Personal Reflections
1. The Evolving Nature of Data Roles
As technology progresses, so do the roles surrounding data analytics. It's not simply about collecting data anymore; it's about interpretation, storytelling, and strategic decision-making. Data professionals are evolving into key players in the business strategy realm.
Have you ever considered how the role of a data analyst is more like that of a detective? Every data point is a clue leading to a greater insight. In this sense, each of us can be a detective in our organizations, uncovering hidden patterns and trends.
2. Staying Relevant
In this ever-changing technological landscape, staying relevant is crucial. Think about it: How often do you hear about new tools, platforms, and methodologies? With innovations popping up every month, you must remain on your toes.
What tools are emerging?
Which skills are in demand?
How can you upscale your expertise?
Networking is a powerful tool that helps. Engage with peers, attend workshops, or simply share thoughts on social media. If you’re not adapting, you risk being left behind.
3. Encouraging Continuous Learning and Networking
Continuous learning is the key to flourishing in your data career. The more you know, the more valuable you become. But how can you maintain this learning momentum? Here are some tips:
Participate in online courses.
Attend webinars.
Join LinkedIn groups focused on data analytics.
Engage in discussions about current trends.
Nikola Ilic, during the livestream, emphasized the value of connecting with other professionals. He encouraged everyone to share their LinkedIn profiles in the comments. Not only does networking open doors, but it also provides fresh perspectives and ideas.
4. Building a Community Around Data Solutions
Community is vital for growth. Whether you’re in-house at a corporation or working as a consultant, there’s strength in numbers. When you build a community around data solutions, you tap into a collective wealth of knowledge.
Start or join forums, meetups, and online discussion groups. These communities can provide you with insights into real-world problems and the solutions people are implementing. You’ll find that learning from shared experiences is invaluable.
5. Nikola's Vision for Data Professionals
During Nikola’s talk, his perspective on the future of data analytics was enlightening. He envisioned data professionals evolving into storytellers, armed with the insights needed to drive strategic decision-making.
Nikola discussed how tools like Microsoft Fabric are just part of the evolving toolkit. As more technologies emerge, they will require us to reshape how we interact with data.
"Learning is a continuous journey in the data field. We must embrace changes and retool ourselves as technologies evolve." – Nikola Ilic
His focus on tools does not diminish the importance of soft skills either. Communication, critical thinking, and collaboration will become essential as data professionals are expected to translate complex data into actionable insights for their teams.
6. Why You Should Care
Now, you might be wondering, why does all this matter? Well, it affects your career trajectory. The landscape of data analytics is shifting. If you embrace these changes, you’ll not only enhance your skills but also boost your employability.
How do you see the world of data analytics affecting you? It’s a perspective worth considering, especially as you engage with these ongoing shifts.
By keeping your finger on the pulse of innovation, committing to lifelong learning, and connecting with like-minded individuals, you'll equip yourself for a bright future in data analytics. The future, indeed, is bright for those who are prepared to embrace it!
6. Conclusion: Composing Your Data Symphony
As we wrap up this exploration of data and analytics, it’s crucial to reflect on the journey you’ve undertaken. Just like a symphony, your path in data is about harmony, connection, and action. Data is more than just numbers; it provides powerful insights that can steer your decisions and strategies. So, what can you do with these insights? Take action! Use them to refine your current practices, embrace new technologies like Microsoft Fabric, and don’t hesitate to innovate. Consider how you can transform data from mere statistics into a melody that resonates with your audience.
Education in today’s fast-paced data landscape is not a luxury; it’s a necessity. Self-education is your ticket to staying relevant and skilled. Dive into online courses, read new publications, and keep abreast of the latest tools and techniques. 🧠 Programs like Coursera or LinkedIn Learning offer fantastic resources for honing your skills, especially if you're looking to gain a deeper understanding of platforms like Power BI or Microsoft Fabric.
But don’t stop at personal development. Networking plays an equally crucial role. Find opportunities to connect with fellow data professionals. Being part of communities expands your knowledge base and opens doors. You can exchange ideas and discuss challenges, which can lead to innovative solutions. Have you thought about joining Meetup groups or sharing your LinkedIn profile with peers? Such actions can amplify your odds of finding mentors and collaborators.
Viewing data analytics as an art form can change your perspective significantly. Data isn’t static; it evolves every day. Treating data analytics as a canvas allows you to creatively express insights. Think about how artists adjust their techniques with changing mediums. Similarly, how can you adjust your data strategies with new tools and paradigms? Embrace the shifts and view challenges as opportunities to innovate.
In this light, it’s essential to embrace the role of a “Data Mozart” in your career. What does that even mean? Like Mozart, strive for mastery. Compose your unique data symphony using your knowledge, experience, and creativity. Engage your audience with compelling narratives driven by data insights that inform, persuade, and inspire. Every dataset is a new score to interpret, and each analysis you conduct is a performance waiting to happen.
“The essence of data analytics lies in its ability to tell stories that drive decisions.”
In conclusion, your development in data analytics can be seen as an ongoing musical composition. 🎶 Every note you play—whether it's through learning, networking, or applying your skills—adds to the depth and richness of your professional narrative. Remember, the landscape is vast, and there are countless opportunities to fine-tune your performance. Seek growth not just in your technical skills but also in your collaborative efforts and creative expression.
So, as you move forward, think about your next steps. Will you take that online course? Reach out to a fellow data professional? Or perhaps reframe your data projects as art? Every little action counts. Step up and compose your data symphony with confidence. Your audience is waiting!
