


Fatal Regression Mistake and How to Dodge It

Let’s talk about the fatal regression mistake that trips up even seasoned data pros: ignoring the warning signs in your regression analysis. When you fall into this trap, you risk misleading insights and unreliable predictions. You might think your linear regression model looks solid, but hidden issues can wreck your predictive modelling efforts. Don’t let a fatal regression mistake derail your hard work—stay sharp, check your data, and always keep your models honest.
Key Takeaways
Always check your data and model assumptions before trusting regression results to avoid misleading predictions.
Explore your data carefully, spot outliers, and choose variables wisely to build stable and accurate models.
Watch out for common problems like multicollinearity, overfitting, and ignoring model assumptions that can ruin your analysis.
Use multiple evaluation metrics and cross-validation to ensure your model works well on new data, not just the training set.
Report your process clearly, including how you handled data and assumptions, to make your analysis trustworthy and repeatable.
Fatal Regression Mistake
What It Is
You might think running a regression analysis is as simple as plugging numbers into a formula and reading the results. But here’s where the fatal regression mistake sneaks in. This mistake, sometimes called “Hasty Regression,” happens when you rush into building a model without checking if your data is ready or if your model makes sense. You might toss in variables just because they seem important, like a policy dummy variable, without asking if they really belong. You skip checking the data for patterns or cleaning up outliers. You ignore whether your model fits the real story behind the numbers.
When you make this mistake, you often see strange things in your results. For example, you might notice:
Very high t-values or F-statistics that look impressive but actually hide problems.
R-squared values that seem perfect, but your model still gives weird predictions.
Residual plots that show patterns, like curves or clusters, instead of random scatter.
Dummy variables that don’t seem to matter, even though you expect them to.
These are warning signs. They tell you that your model might be missing something important or that you’re confusing correlation vs causation. Tools like the Ramsey RESET test or looking at residual plots can help you spot these issues. If you ignore them, you risk building a model that looks good on paper but fails in real life.
Tip: Always check your data and model assumptions before trusting your regression analysis results. A careful start saves you from big headaches later.
Why It Matters
The fatal regression mistake doesn’t just make your numbers look odd. It can lead to real-world problems. Imagine you’re trying to predict fatal crashes on the road. If your model is built in a hurry, it might miss almost every real crash, even if the numbers look fine at first glance.
Let’s look at what happens when you compare two models for predicting fatal crashes:

You can see that the classic model (LM) fails to catch any real fatal crashes. The improved model (RELM) does much better, finding most of them and giving a much higher accurate classification rate. This shows how a fatal regression mistake can make your model useless for real decisions.
Researchers also use tools like the area under the ROC curve (AUC-ROC) to check how well a model separates real events from false alarms. When you use cross-validation, you test your model on different parts of the data to make sure it works everywhere, not just on one lucky sample. This helps you avoid overfitting and makes your predictions more reliable.
Here are some things that can happen if you don’t dodge the fatal regression mistake:
Your model misses important events, like fatal crashes, because it’s not set up right.
High R-squared or t-values trick you into thinking your model is great, but it fails on new data.
You waste time and resources making decisions based on bad predictions.
Note: A good regression analysis is not just about getting high scores. It’s about building a model that works in the real world and helps you make smart choices.
Causes in Regression Analysis
Multicollinearity
Multicollinearity is one of those common problems that can sneak up on you during regression analysis. Imagine you’re trying to listen to two people talking at once, both saying almost the same thing. It’s hard to tell who’s saying what. In regression analysis, this happens when two or more predictors are highly correlated. Your model struggles to figure out which variable is actually making the difference. This confusion leads to unstable coefficients and makes your predictions less reliable.
You can spot multicollinearity by checking the Variance Inflation Factor (VIF). If you see VIF values above 5 or 10, you know you have a problem. Researchers often combine similar variables or use regularization methods like ridge regression to fix this. For example, in one study, variables with high VIF were combined into a single measure to avoid this pitfall. When you ignore multicollinearity, your model’s coefficients can swing wildly with small changes in data, making it tough to trust your results.
Overfitting and Underfitting
Overfitting and underfitting are two sides of another common problem in regression analysis. Overfitting is like memorizing every answer on a practice test. You ace the test but struggle with new questions. Your model fits the training data perfectly but fails with new data. Underfitting is the opposite. It’s like skimming the textbook and missing key details. Your model is too simple and misses important patterns.
Researchers use tools like the Akaike Information Criterion (AIC) and cross-validation to find the right balance. They also run experiments, adjusting model complexity and checking how well the model predicts new data. When you get this balance right, your regression analysis becomes much more reliable.
Ignoring Assumptions
Ignoring assumptions is a trap that can ruin your regression analysis. Every model relies on certain rules, like linearity and independence. If you skip checking these, your results can become biased or inconsistent. For example, leaving out an important variable or assuming a straight-line relationship when the real world is more complex can lead to big errors.

Avoiding Pitfalls
Data Exploration
Before you jump into building a regression model, take time to explore your data. Think of this step as getting to know your team before a big game. You want to know who’s strong, who needs help, and where surprises might pop up. Start with simple checks like looking at the mean, median, and standard deviation for each variable. These numbers tell you about the center and spread of your data.
Next, use graphs like histograms and box plots. These visuals help you spot outliers and see if your data looks normal or skewed. Scatter plots show relationships between two variables. If you see a strong pattern, you might have a good predictor for your model. Always check for missing values and odd entries. Cleaning your data now saves you from headaches later.
Here’s a quick checklist for data exploration:
Review summary statistics (mean, median, mode, variance).
Visualize data with histograms, box plots, and scatter plots.
Check for missing values and outliers.
Look for patterns or relationships between variables.
Use correlation coefficients to spot strong links.
Tip: Careful data exploration helps you avoid common mistakes and sets the stage for avoiding pitfalls in regression analysis.
Variable Selection
Choosing the right variables is like picking the best players for your team. You want predictors that add value, not just extra noise. If you include too many variables, your model might overfit. If you use too few, you risk underfitting and missing important patterns.
Start with variables that make sense based on your knowledge or expert advice. This approach helps you avoid adding random predictors that don’t belong. Use methods like backward elimination or LASSO to trim down your list. These techniques remove variables that don’t help your model, making it simpler and more reliable. Research shows that combining expert input with data-driven methods leads to models that explain more variance and have better predictive accuracy.
When you select variables, check for multicollinearity. Use the Variance Inflation Factor (VIF) to see if predictors are too similar. If VIF is high, consider removing or combining variables. This step keeps your model stable and helps you dodge the trap of unstable coefficients.
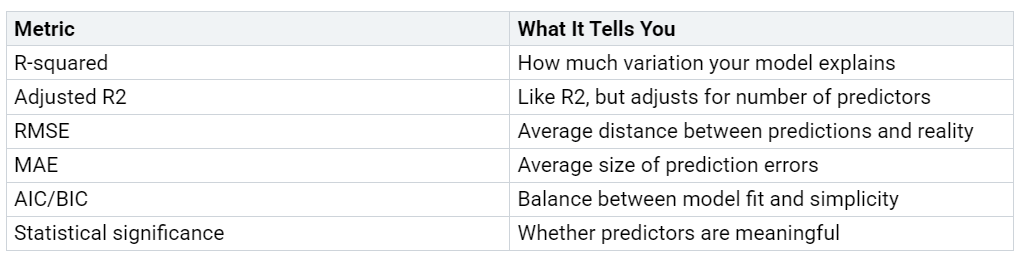
Model Evaluation Metrics
Once you build your model, you need to know how well it works. Don’t just look at one number. Use a mix of metrics to get the full picture. R-squared tells you how much of the variation in your outcome your model explains. Adjusted R-squared is even better when you have many variables, because it penalizes unnecessary complexity.
Other important metrics include:
Root Mean Square Error (RMSE): Shows how close your predictions are to actual values. Lower is better.
Mean Absolute Error (MAE): Measures the average size of errors in your predictions.
Pearson’s Correlation Coefficient: Checks the strength of the linear relationship between predicted and true values.
Akaike Information Criterion (AIC) and Bayesian Information Criterion (BIC): Help you compare models by balancing fit and complexity.
Statistical significance: Always check if your predictors matter. Look for p-values below 0.05 to see if a variable is likely to be important.
Note: Use cross-validation to test your model on different data splits. This step helps you avoid overfitting and ensures your model works well on new data. Regularization methods like Ridge and LASSO also help keep your model from getting too complex.
Handling Outliers
Outliers are data points that don’t fit the usual pattern. They can mess up your regression analysis by pulling your results in the wrong direction. Imagine one player on your team always runs the wrong way—your game plan falls apart.
You can spot outliers using box plots, scatter plots, or by checking if a value is far from the mean (using Z-scores or IQR). Once you find them, decide what to do:
Check for errors: Sometimes outliers are just mistakes. Fix or remove them if they don’t belong.
Transform the data: Use log or square root transformations to reduce the impact of outliers.
Use robust regression: Methods like RANSAC or Huber Regression are less sensitive to outliers.
Winsorize or cap values: Limit extreme values so they don’t dominate your results.
Impute values: Replace outliers with the mean or median if it makes sense.
Keep them (with caution): Sometimes outliers are real and important. Use your knowledge to decide.
Alert: Always use domain knowledge when handling outliers. Removing them without a good reason can hide important information.
By following these steps, you put yourself in the best position for avoiding pitfalls in regression analysis. You build models that are reliable, accurate, and ready for real-world challenges. Remember, the goal is not just to get good numbers, but to make smart, trustworthy predictions.
Linear Regression Pitfalls
Model Misspecification
Model misspecification happens when your linear regression model does not match the real-world process. You might leave out important variables, use the wrong type of relationship, or ignore how your data behaves. This mistake can sneak in easily. Maybe you assume a straight-line relationship when the data actually curves. Sometimes, you forget to control for a key factor, like age or income.
Let’s look at what happens when you misspecify your model. In one case study, researchers compared different ways to set the risk period in a regression-like model. When they used the correct risk period, bias and error stayed low. But when they guessed wrong, bias shot up and results became unreliable. The table below shows how different methods stack up:

If you use a small sample or have skewed data, the risk of bias grows. Outliers can make things even worse. Leaving out important variables leads to what experts call omitted variable bias. Multicollinearity, where predictors are too similar, makes your coefficients unstable. You might think your linear regression is solid, but these hidden traps can throw off your predictions.
Misinterpreting Results
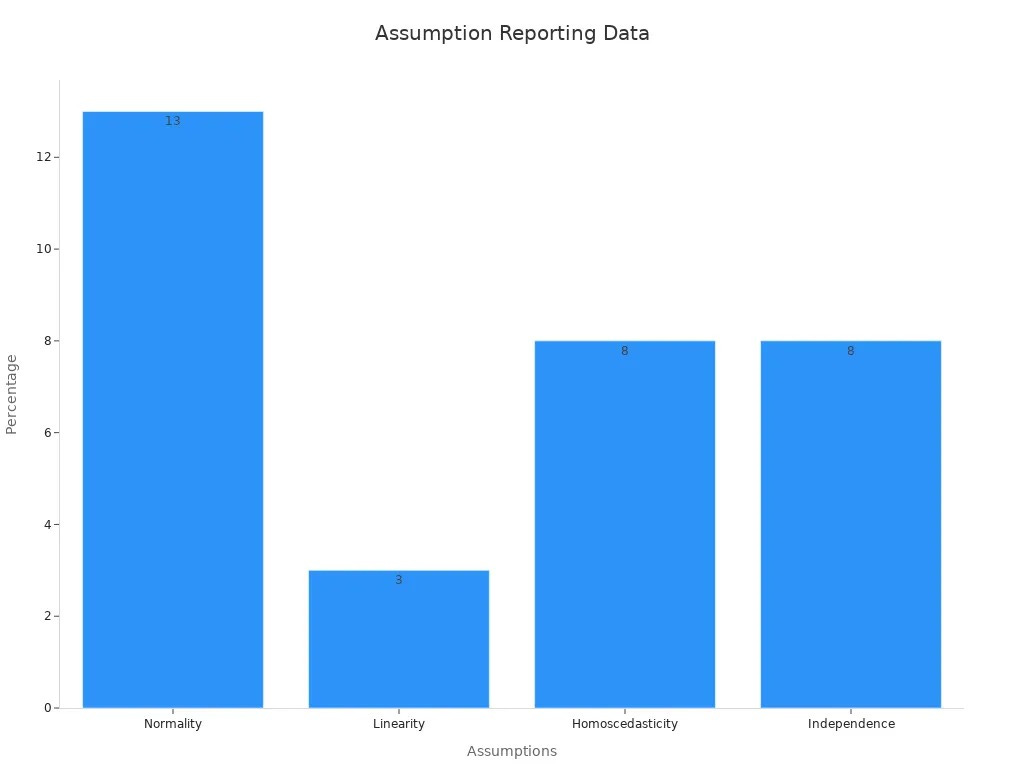
It’s easy to misinterpret regression results if you skip key checks or misunderstand what the numbers mean. Many people see a high R-squared and think their linear regression is perfect. But that’s not always true. Sometimes, you find a strong correlation, but it does not mean one thing causes the other. You need to use your knowledge and look deeper.
A review of 95 research papers found that only 37% checked any model assumptions. None checked all of them. Many confused the normality of the dependent variable with the normality of residuals. This led to poor ratings for statistical quality. The chart below shows how often researchers reported checking each assumption:
Misinterpretation can also happen when you ignore regression to the mean. For example, if a student scores very high on one test, their next score will likely be closer to average. If you don’t know this, you might think your new teaching method worked wonders. Outliers can also trick you. Events like Black Monday in finance or unusual sports scores can pull your linear regression line in the wrong direction.
Here’s a quick table of common pitfalls and their impacts:
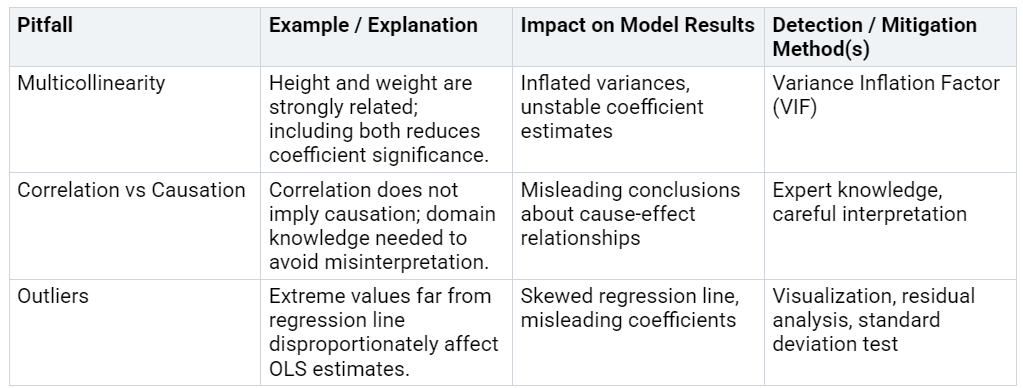
If you want to interpret regression results correctly, always check your assumptions, look for outliers, and use your own expertise. Linear regression is powerful, but only when you use it with care.
Best Practices for Regression Analysis
Checking Assumptions
You want your regression analysis to give you results you can trust. That means you need to check if your model’s assumptions hold up. Think of these assumptions as the rules of the game. If you break them, your results might not mean what you think.
You can use both graphs and formal tests to check these rules. For example, scatter plots and residual plots help you see if your data follows a straight line or if the spread of errors looks even. Q-Q plots show if your errors look normal. Formal tests like the Breusch-Pagan test check for equal spread (homoscedasticity), while the Durbin-Watson statistic checks if errors are independent. The Shapiro-Wilk test helps you see if your errors are normally distributed.
Here’s a quick table to guide you:
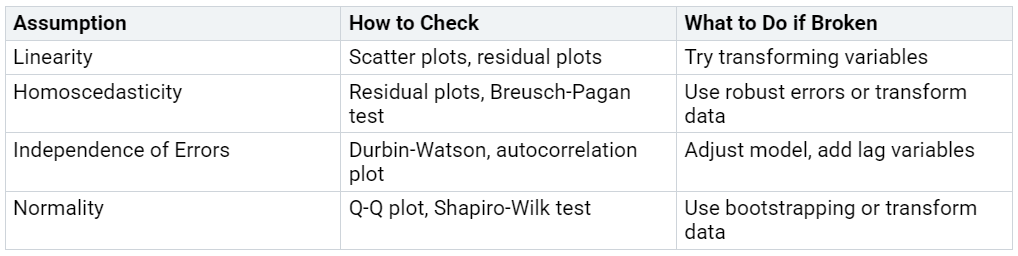
Tip: Graphs help you spot big problems fast. Tests give you numbers to back up what you see. Use both for the best results.
Reporting and Documentation
Clear reporting makes your regression analysis stronger and more useful. Start with an Initial Data Analysis (IDA) plan. This plan helps you check your data for missing values, outliers, or the need to change variables before you build your model. Write down every step you take, including any changes you make along the way.
When you share your results, include more than just the numbers. Report your regression coefficients, confidence intervals, and p-values. This helps others see the size and certainty of your findings. Always mention how you handled missing data and which variables you included or left out. If you did any sensitivity analyses, explain what you changed and why.
List all model assumptions you checked.
Show how you handled missing data.
Report both statistical significance and effect sizes.
Use checklists or templates to make sure you don’t miss anything.
Being open about your process helps others trust your work and makes it easier for them to repeat your analysis.
You now know how to dodge the fatal regression mistake and build stronger models. Remember to explore your data, pick the right variables, and check your model’s fit using key statistics like R-squared, adjusted R-squared, and the Durbin-Watson statistic.
Interpret results with care
Keep learning with methods like Lean and Six Sigma
Stay curious and keep improving your skills—your next analysis will be even better! 🚀
FAQ
What is the most common mistake in regression analysis?
You often see people ignore model assumptions or skip checking for multicollinearity. These mistakes can lead to unreliable results. Always check your data and model before trusting the output.
How do I know if my regression model is overfitting?
If your model performs great on training data but poorly on new data, you probably have overfitting. Try cross-validation or use fewer variables to fix this issue.
Why should I check for outliers before running regression?
Outliers can pull your results in the wrong direction. They might hide real patterns or make your predictions less accurate. Always look for outliers and decide how to handle them.
Can I use regression if my data is not linear?
You can, but you need to transform your data or use a different model. Linear regression works best when the relationship between variables is straight. Try polynomial regression or log transformations if you see curves.
What does a high R-squared value really mean?
A high R-squared means your model explains a lot of the variation in your data. It does not always mean your model is good. You still need to check for overfitting and other problems.