


How to Use Data Modeling for Better Business Analytics

Data modeling can change the way you approach business analytics by turning scattered information into clear, useful insights. Imagine trying to make decisions with messy data—duplicates, gaps, and errors slow you down and lead to mistakes. Now picture Airbnb, which improved booking conversion rates by nearly 4% after using data modeling to clean and organize its data.
They fixed structural errors, removed duplicates, and normalized data points, which helped reduce bias and improve data management.
When you follow steps like data cleansing and normalization, you gain a much clearer view for analytics and better business analytics results.
Reflect on your own data management practices. Are you confident your data supports strong analytics and decision-making?
Key Takeaways
Data modeling organizes messy data into clear structures, helping businesses make faster and smarter decisions.
Using different types of data models—conceptual, logical, and physical—creates a strong path from business goals to technical solutions.
Following steps like gathering requirements, building models, and validating them ensures your data supports accurate and useful analytics.
Maintaining high data quality through cleansing, monitoring, and documentation prevents errors and builds trust in your insights.
Tools like Power BI enhance data modeling by connecting sources, automating updates, and creating interactive reports that improve decision-making.
Data Modeling in Business Analytics
What Is Data Modeling?
You use data modeling to create a clear map of how your data works. This process involves drawing diagrams that show how you store, access, and manage information across your systems. You can think of data modeling as a blueprint for your databases and data architecture.
You start by identifying the main entities, their attributes, and how they relate to each other.
You choose the right type of model—conceptual, logical, or physical—based on your needs.
You use tools like entity-relationship diagrams to visualize your data structure.
Data modeling helps you organize your data, making it easier to manage and use for business analytics.
Why It Matters for Business Analytics
You face a world where global data creation is expected to reach 175 zettabytes by 2025. Businesses like yours rely on data modeling to handle this massive scale.
75% of companies plan to use AI-driven analytics by 2026, which requires strong data modeling techniques.
The self-service business intelligence market will likely exceed $14 billion by 2026, showing the demand for accessible analytics tools built on solid data models.
Companies such as UPS use real-time analytics to optimize delivery routes, analyzing millions of packages and external factors. Data modeling makes this possible by organizing data for immediate use.
Note: Robust data modeling supports data quality, governance, and continuous improvement in analytics. Without it, you risk slow decision-making and missed opportunities.
Key Benefits
You gain measurable improvements in business analytics when you use data modeling. Recent studies show that organizations with strong data modeling practices see faster trend detection, better predictive analytics, and higher data quality.
You also see benefits like improved data understanding, enhanced data consistency, and efficient data management. In healthcare, you can manage patient data better. In finance, you track transactions and detect fraud. In e-commerce, you analyze customer behavior and boost operational efficiency.
Data modeling forms the backbone of your data architecture and business analytics, helping you turn raw data into actionable insights.
Types of Data Models
Conceptual, Logical, Physical
You can use three main types of data modeling to organize your data: conceptual, logical, and physical models. Each type serves a unique purpose in your data architecture.
Conceptual data modeling gives you a high-level view of your data. You identify the main entities, such as customers or products, and show how they relate. This model helps you and your team communicate with business stakeholders. You clarify complex requirements and create a shared understanding of business terms and relationships.
Logical data modeling adds more detail. You define the structure of your data, including attributes and relationships. This model bridges your business needs with technical design. You ensure your data supports key business functions and maintains data integrity.
Physical data modeling translates your logical design into a technical blueprint. You specify tables, columns, indexes, and other database details. This model optimizes your database for performance and security.
Tip: When you move from conceptual to logical to physical models, you create a clear path from business goals to technical solutions. This structured approach helps you spot gaps early, reduce errors, and improve decision-making.
You save time and money by investing in solid data modeling. You avoid inconsistencies and errors by structuring your data correctly from the start. Logical models help you turn business ideas into actionable components. Physical models ensure your database runs smoothly and supports your analytics needs.
Dimensional Data Modeling
Dimensional data modeling makes business analytics easier for you and your team. You use this approach to organize your data into facts and dimensions. Facts are measurable events, like sales or transactions. Dimensions are categories, such as time, location, or customer.
You reduce noise and irrelevant features, which improves the clarity of your data.
You focus on principal variables, which enhances model performance.
You speed up computation and reduce storage needs.
You make complex, high-dimensional data easier to interpret.
You visualize patterns and trends more easily.

You can connect multiple data sources using dimensional data modeling. You simplify your data structure, which helps you build dashboards and reports faster. You also improve data quality and data integrity, which supports better business analytics. This approach forms a strong foundation for your data architecture and helps you get the most value from your data.
Data Modeling Steps
You can unlock the full power of business analytics by following a structured approach to data modeling. Each step builds on the last, helping you create a reliable foundation for your data architecture. Let’s walk through the process, from gathering requirements to validating and refining your models.
Requirements Gathering
You start every successful data modeling project by understanding what your business needs. This step sets the direction for your entire data architecture. You gather requirements by talking with stakeholders, reviewing business processes, and analyzing current data sources. You want to know what questions your team needs to answer and what decisions you want to support.
Industry experts recommend several techniques to make requirements gathering effective:
Align your data models with business objectives by working closely with stakeholders.
Use interviews, surveys, and workshops to collect detailed requirements.
Create prototypes or visual diagrams to confirm your understanding.
Review requirements with your team to catch errors or gaps.
Simulate data flows to verify that your requirements match real-world scenarios.
You should always document your findings. Clear documentation helps you avoid misunderstandings and keeps everyone on the same page. When you gather requirements carefully, you set yourself up for a data modeling process that supports your business goals and maintains data integrity.
Tip: Visual diagrams and prototypes help you communicate complex ideas and align your data models with business rules.
Building Models
Once you have your requirements, you move on to building your data models. This step turns your ideas into a visual map of your data. You start by identifying key entities, such as customers, products, or transactions. You define the attributes for each entity and map out how they relate to each other.
Here is a typical sequence you can follow:
Identify entities relevant to your business domain.
Determine key attributes for each entity.
Define relationships among entities using diagrams like UML or entity-relationship models.
Map attributes to entities to reflect how your business uses data.
Normalize your data model to reduce redundancy and improve data integrity.
Iterate and refine your model as you gather feedback.
You can use tools like ER diagrams or dimensional modeling to make your models easy to read and share. Many organizations, such as retail analytics platforms, use event-driven architectures and combine real-time and batch processing to handle large volumes of data. They evolve their data models to include new entities, like user sessions or clickstream data, and use NoSQL databases for scalability. By integrating data governance tools, you can track data lineage and control access, which strengthens your data architecture.
Real-world examples show how effective data modeling strategies support business growth. For instance, e-commerce companies often normalize customer and order data to reduce redundancy. They may denormalize data for reporting to speed up queries. Banks optimize their data models to meet regulatory requirements, while marketing teams use data modeling to deliver personalized experiences.
Note: Always balance normalization and denormalization to optimize both data integrity and performance.
Validating and Refining
You need to make sure your data models work as intended before you put them into production. Validation and refinement help you catch errors, improve accuracy, and ensure your models support business needs. You can use several techniques to validate your data models:
Test your models with sample data to confirm they handle real-world scenarios.
Use version control to track changes and maintain consistency.
Collaborate with stakeholders to review and approve your models.
Apply data profiling to detect quality issues early.
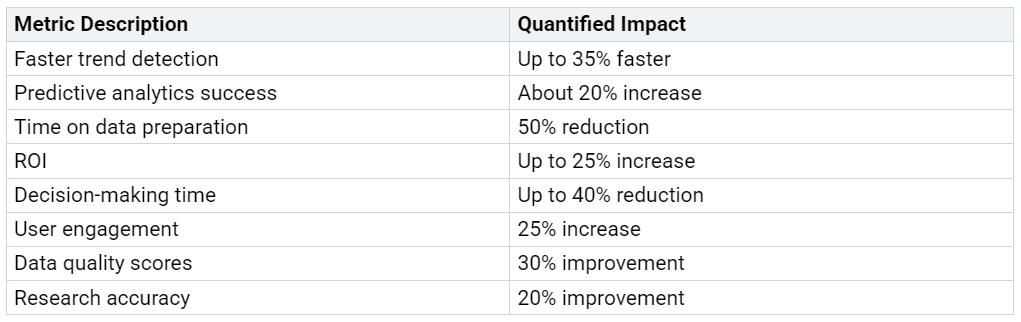
You should also measure your models using key performance metrics. Here is a table of common metrics and their importance:

You should refine your data models as your business evolves. Monitor performance, gather feedback, and update your models to keep them relevant. The New York Times’ COVID-19 Dashboard and The Guardian’s Election Data project both used ongoing validation and refinement to deliver accurate, up-to-date analytics.
Remember: Continuous validation and refinement keep your data modeling efforts aligned with business needs and ensure your data remains trustworthy.
Data Quality and Best Practices
Ensuring Data Quality
You need strong data quality to get reliable results from your data modeling. Poor data can lead to costly mistakes. For example, Toyota faced a massive recall in 2009-2010 because of data management errors. Wells Fargo suffered reputational damage and fines when poor data oversight allowed fake accounts to go undetected. These cases show why you must focus on data governance, profiling, cleansing, and continuous monitoring.
To ensure high data quality, you can:
Validate data at entry points with required fields and format checks.
Cleanse data regularly and remove duplicates to keep accuracy high.
Use data profiling tools to spot patterns, outliers, and anomalies.
Standardize data formats and definitions across your organization.
Apply master data management to maintain a single source of truth.
Audit data quality with both automated scans and manual reviews.
Train your team on best practices for data quality.
Use AI tools to detect and flag issues early.
A Microsoft DevOps case study showed a 58% drop in system downtime after adding continuous data quality monitoring. This proves that good practices make a real difference.
Tip: Regular monitoring and feedback loops help you catch problems before they grow.
Documenting Models
Clear documentation supports data integrity and helps everyone understand your data modeling process. You should record definitions, relationships, and business rules for each model. Good documentation makes it easier to update models and train new team members. It also helps you track changes and maintain data management standards.
Try using tables or diagrams to show how entities connect. Keep your documentation up to date as your business changes. When you document well, you protect data integrity and make your analytics more trustworthy.
Collaboration Tips
Collaboration between business and technical teams improves your data modeling success. When everyone shares access to data and works toward common goals, you build trust and get better results. A 2021 study found that equal access to shared data and aligned motivations lead to effective cooperation. In healthcare, data teams and domain experts work together to enrich insights and improve decisions.
You can boost collaboration by:
Setting up shared processes for data intake and review.
Holding regular meetings to align on goals and progress.
Encouraging open communication between teams.
Using collaborative tools to track changes and feedback.
When you break down silos and combine expertise, you improve data integrity, speed up analysis, and deliver better business outcomes.
Power BI for Data Modeling
Using Power BI Tools
You can transform your business analytics by using Power BI for data modeling. Power BI gives you a powerful set of tools to connect, shape, and visualize your data. You can pull data from many sources, including Excel, SQL databases, cloud services, and on-premises systems. This flexibility helps you build a strong data foundation for your analytics.
Power BI supports real-time data access, so you always work with the latest information. You can create customizable dashboards that let you see key metrics at a glance. These dashboards help you make quick decisions and solve problems faster. Power BI also integrates with Microsoft products, making it easy to connect your data across platforms.
Here are some practical tips for getting the most out of Power BI:
Use dataflows to automate data preparation and keep your data up to date.
Take advantage of AI features for image recognition, text analytics, and building machine learning models.
Set up row-level security to protect sensitive data and give users only the access they need.
Use incremental refresh to handle large datasets efficiently.
Build interactive dashboards to let users explore data on their own.
Tip: Power BI’s self-service features reduce your reliance on IT support, so you can create and share reports quickly.
A table below highlights key benefits you gain from using Power BI in your data modeling efforts:

Integrating Data Models
You can combine traditional data modeling techniques with Power BI to build robust analytics solutions. Power BI works well with star schemas, which organize your data into fact and dimension tables. This structure makes your queries faster and your reports easier to build. You can also use snowflake schemas for more complex data needs, or factless fact tables to track events without numeric measures.
Power BI offers advanced integration features:
Composite models let you mix live and imported data, balancing speed and freshness.
Parameter tables allow dynamic filtering and easy switching between categories.
Hierarchies help you create drill-down reports for deeper insights.
Aggregations improve query performance, especially with large datasets.
Best practices for integrating your data models in Power BI include:
Adopt star schemas when possible to simplify your models.
Reduce cardinality to speed up your reports.
Use calculated columns only when necessary to keep your model lean.
Leverage row-level security for safe, user-specific data views.
Many companies have seen real results with Power BI. For example, an e-commerce business used Power BI to build a recommendation engine, which increased sales and improved customer satisfaction. A global logistics company used Power BI’s predictive analytics to optimize shipments, reduce costs, and deliver faster.
Remember: Power BI’s regular updates and community-driven features keep your analytics tools current and effective.
Challenges and Solutions
Common Issues
You often face several challenges when working with data for business analytics. One major issue is poor data quality. Errors can come from missing values, duplicates, or inconsistent formats. These problems make it hard to trust your results. You may also struggle with integrating data from different systems, which can lead to confusion and wasted time. Sometimes, you find that your data has autocorrelation or non-uniform time intervals, especially in time series analysis. These issues can reduce the power of your statistical tests and make it harder to draw reliable conclusions.
A recent study shows that advanced clustering methods, such as Dynamic Time Warping, help address problems like autocorrelation and response spikes. The study also highlights the importance of using proper statistical tests, such as the chi-square test, and following best practices to avoid errors. Here is a summary of common challenges and solutions:
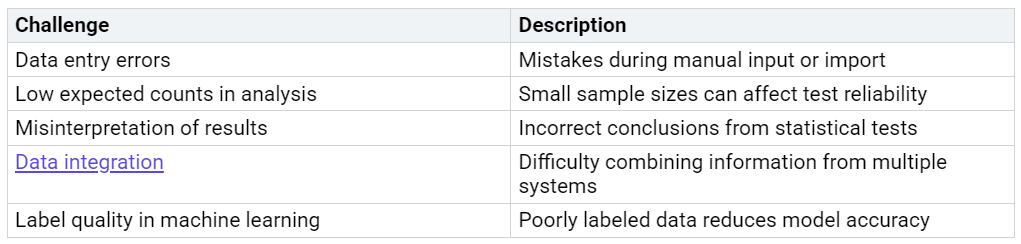
Tip: Use software tools for validation and document your methods to improve reliability.
Overcoming Obstacles
You can overcome these obstacles by following proven strategies. Start by defining clear ownership for your data. Assign responsibility so that someone always monitors quality and addresses issues quickly. Trace the origin of problems by reviewing data lineage. This helps you find the root cause, which is often a human error rather than a system fault.
Here are steps you can take to resolve data challenges:
Set up escalation paths for unresolved issues.
Fix incorrect data and improve processes through training and technical updates.
Track progress on issue resolution to spot bottlenecks.
Close each issue with documentation and verification.
You should also use preprocessing techniques like imputation and normalization to improve data quality. Regular audits and monitoring help you catch problems early. Large companies, such as GE Renewable Energy and Siemens Energy, have improved performance by integrating AI and machine learning with sensor data. These companies saw increased efficiency and reduced downtime by focusing on quality and collaboration.
Remember: Success comes from combining technical solutions with strong teamwork and clear communication.
You gain real advantages when you use structured approaches for business analytics. Many organizations have improved sales, found new customer groups, and managed inventory better by analyzing data from different sources.
A global coffee brand boosted site selection and sales with geographic data.
E-commerce retailers discovered new product opportunities through customer analysis.
Multilevel modeling helps you get more accurate results, even with smaller samples.
Start by reviewing your current analytics process or launch a small project. Keep learning and work closely with your team. When you use data well, you unlock growth and smarter decisions.
FAQ
What is the main goal of data modeling in business analytics?
You use data modeling to organize information so you can find patterns and make better decisions. It helps you turn raw data into clear insights that support your business goals.
How often should you update your data models?
You should review your models whenever your business changes or you add new data. Regular updates keep your analytics accurate and useful.
Can you use data modeling with small businesses?
Yes, you can use data modeling in any business size. Even small companies benefit from organizing their data to improve reporting and decision-making.
What tools help you build data models?
You can use tools like Power BI, Microsoft Visio, or Lucidchart. These tools let you create diagrams and manage your data visually.
Why does data quality matter in analytics?
High-quality data gives you reliable results. If your data has errors, your analysis may lead you to the wrong conclusions.