


Have you ever watched a symphony orchestra perform? The seamless blend of various instruments guided by a conductor can leave you awe-inspired. Interestingly, I’ve come to realize that synchronizing a data team carries similarities to this orchestral harmony. Both necessitate coordination and a shared understanding to translate disparate inputs into beautiful outputs. In this post, we’ll delve into how applying the conductor’s approach to data management can fundamentally shift how organizations perceive and utilize their data.
The Conductor's Paradigm: Understanding the Essentials
In the world of orchestras, the conductor plays a pivotal role. They guide musicians, ensuring harmony and rhythm. But what if I told you that the role of the conductor can be likened to that of a data leader in an organization? Both positions demand leadership, coordination, and a clear strategy. Just as a conductor interprets a score, data leaders must navigate the complexities of data management to drive success.
Role of the Conductor vs. Data Leadership
Let’s think about it. A conductor directs an orchestra, bringing together various instruments to create a symphony. Similarly, a data leader must harmonize different teams—like IT, marketing, and sales—to make sense of the data. They ensure everyone understands their part in the larger picture.
Motivation: A conductor motivates musicians with energy and vision. Data leaders must motivate their teams to embrace data-driven decision-making.
Guidance: Conductors guide musicians through complex scores. Data leaders navigate intricate data landscapes, ensuring teams understand how to use data effectively.
Just as a conductor needs to rehearse with their orchestra, data leaders must continuously engage their teams. They need to foster a culture where data flows freely and insights are shared openly. After all, a conductor without a score is lost, much like a team without a data strategy.
Importance of Coordination Across Departments
Coordination is key in both settings. In an orchestra, each musician plays a unique role, and their performance affects the whole. The same applies to any organization. If one department falters, it can impact the entire business.
Here are some critical points to consider:
Cross-Department Collaboration: Data flows through various departments. Each team has insights that, when shared, can amplify the overall effectiveness.
Shared Goals: When departments work together, they align their objectives. This shared vision enhances data initiatives, leading to better outcomes.
Think of it as an orchestra where each section—strings, brass, percussion—must collaborate to deliver a beautiful performance. The same is true for data teams; they must collaborate to convert data into actionable insights.
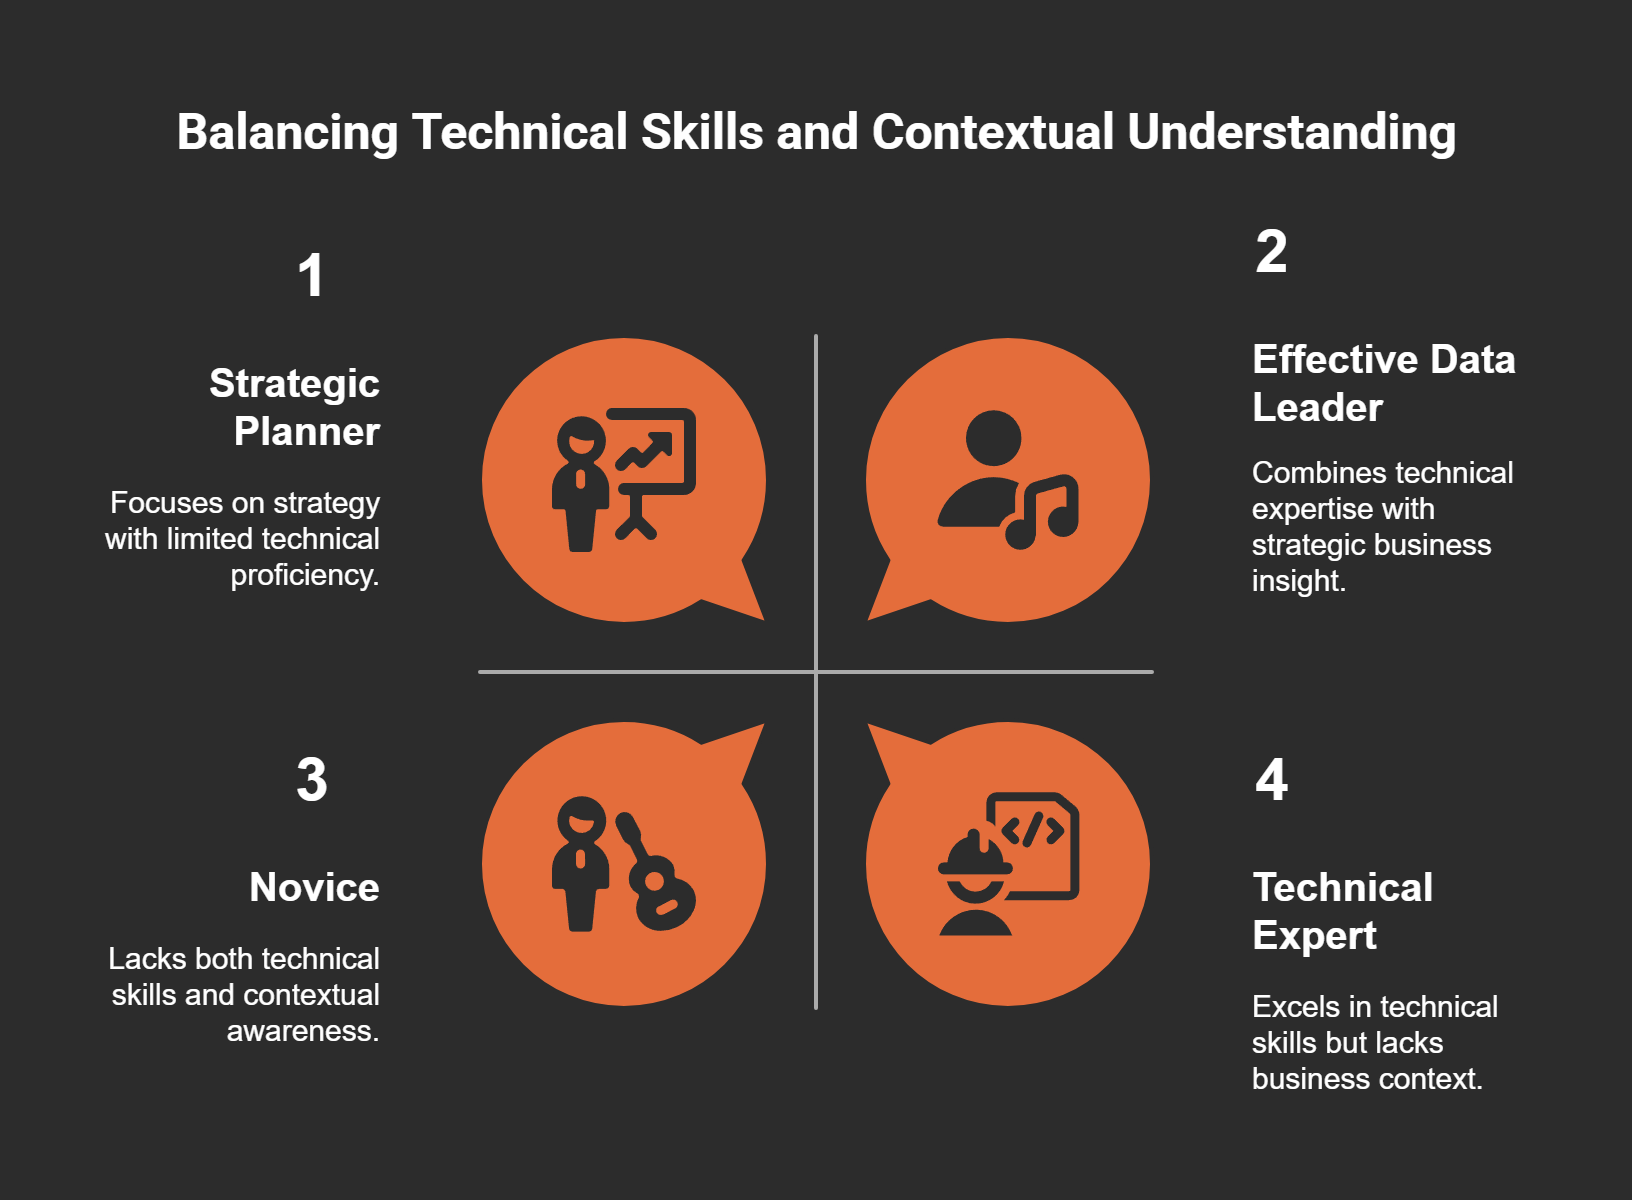
Common Missteps: Focusing Solely on Technical Skills
One of the biggest missteps I’ve observed is the overemphasis on technical skills. Organizations often invest heavily in technology, believing it’s the silver bullet. But technology without context is futile. It’s not just about having the best tools; it’s about understanding the underlying business needs.
Consider this:
Context Matters: Technology can gather data, but without a clear understanding of its context, the insights generated can miss the mark.
Human Element: Data projects require people who can interpret data and translate it into meaningful actions, not just analysts who can crunch numbers.
Organizations that focus solely on technical skills often find themselves lost, just like a conductor without a score. They fail to connect the dots between data and business value, leading to missed opportunities.
Establishing a Shared Map of Data Flows
So, how can organizations overcome these challenges? One effective approach is to establish a shared map of data flows. This visual guide helps everyone understand how data moves through the organization and its relevance to various departments.
To create a shared map:
Identify Key Processes: Start by pinpointing business processes that rely heavily on data.
Engage Users: Gather feedback from different departments about their interaction with data.
Document Data Origins: Track where data comes from and how it transforms as it flows through the organization.
By visualizing this journey, organizations can preserve the meaning of data at each stage. This clarity is essential for effective decision-making. Imagine trying to navigate a new city without a map; it would be nearly impossible. A shared data map serves the same purpose—it guides teams through the complexities of data management.
Through this process, we can see that both orchestras and data teams thrive on coordination. Both require clear leadership, a shared understanding of goals, and a commitment to collaboration. With this in mind, we can better appreciate the intricacies of data-driven decision-making and the importance of effective leadership.
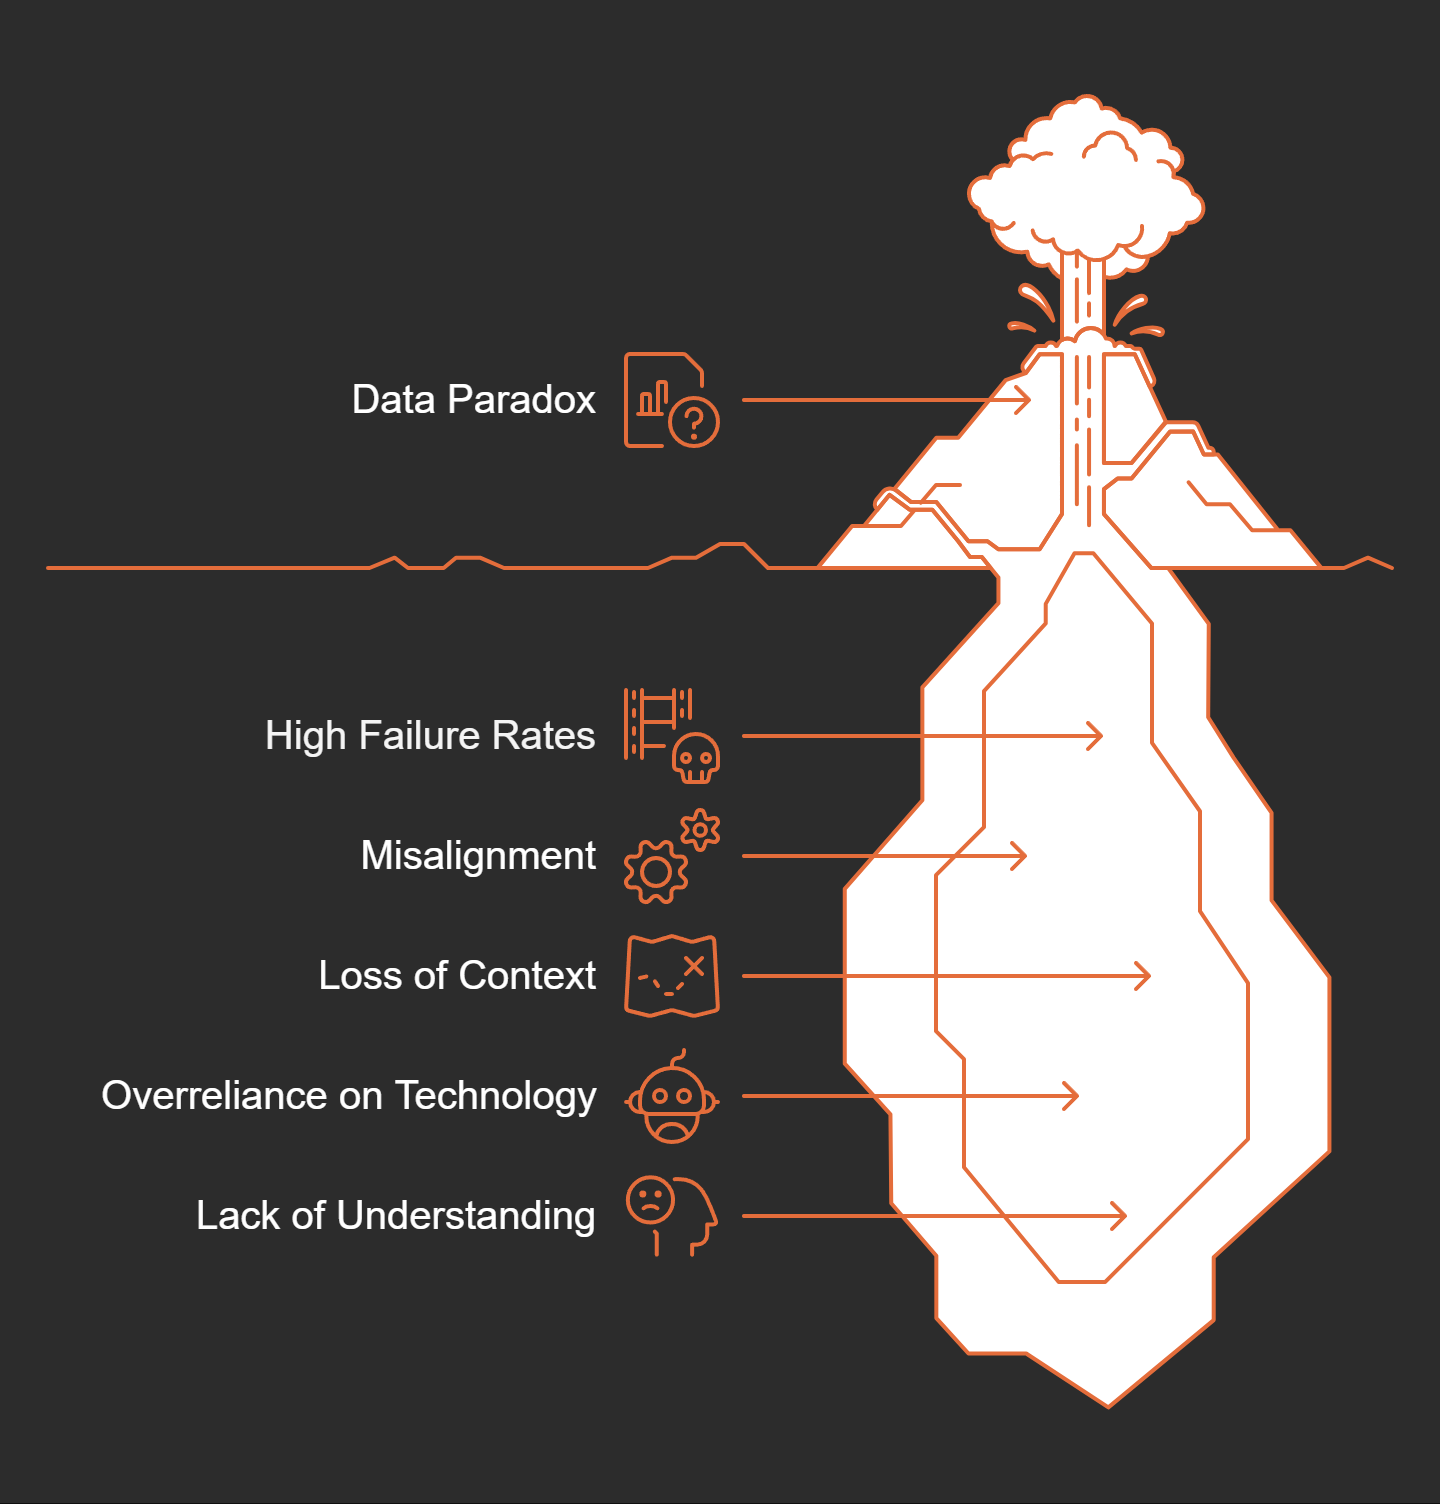
The Data Paradox: What's Behind High Failure Rates?
As I delve into the world of data management, I can't help but feel a sense of urgency. We're facing a startling truth. According to Gartner, 75% to 80% of data initiatives fail. That's right. A huge chunk of resources, time, and effort goes down the drain. Think about it: three out of every four data projects you invest in will likely fail to deliver their promised value. This is not just a statistic; it’s a wake-up call.
Why Such High Failure Rates?
First, let’s unpack why technology alone isn’t a silver bullet. Many organizations pour money into sophisticated tools and platforms, believing they can solve all their problems. But that's a misconception. Technology is just a tool. It requires human insight, strategy, and alignment with business goals to be effective. We can’t simply throw tech at the problem and expect it to go away.
One major issue I’ve observed is the misalignment between technical teams and business goals. Often, data teams work in silos, disconnected from the core objectives of the business. This lack of communication can create a chasm between what data analysts think they’re achieving and what the business needs. Have you ever felt like your team was working hard but not necessarily on the right things? You’re not alone. Many organizations experience this disconnect.
Recognizing Real Obstacles to Data Success
So, what are the real obstacles to success? Here are a few key points to consider:
Misunderstood Data Context: Data is often seen as just numbers and letters. However, it carries significant meaning tied to customer behaviors, market trends, and operational metrics.
Loss of Context: As data moves through different departments, its meaning can get lost. This makes it difficult to make informed decisions.
Overreliance on Technology: Just because you have the latest software doesn’t mean you’re using data effectively. It’s about how you interpret and utilize that data.
To illustrate, let me share a couple of examples. A major retailer invested heavily in a customer data platform. They gathered tons of information on transactions and demographics. Yet, they struggled to derive actionable insights. Why? Because the insights didn’t address the core questions that store managers needed to enhance the customer experience. Similarly, a healthcare organization integrated a data warehouse that, while impressive, did not support clinician workflows effectively. This disconnect led to a lack of clinical relevance in data insights.
These examples highlight a common thread. The fundamental challenge is preserving data context as it flows through an organization. Each step in the user journey—from initial business knowledge to final analysis—creates opportunities for context to be lost or diluted. It’s like navigating an unfamiliar city without a map. How can you ensure you’re heading in the right direction without clear guidance?
The Importance of Understanding Business Objectives
I can’t stress enough the importance of understanding business objectives. Organizations need to recognize that raw data is just isolated facts without context. Knowledge emerges when data is structured and contextualized for effective business decisions.
As my colleague Natalie from SBTI Corp pointed out, understanding users’ actions and data capture points is essential for managing data effectively. Without this awareness, organizations risk collecting meaningless data rather than leveraging insights that can drive value.
"These aren't just minor setbacks; these are business crises waiting to happen."
This quote resonates deeply with me. It’s a reminder that the implications of failing to align data initiatives with business goals are severe. We need to avoid these crises by focusing on small, focused initiatives rather than sprawling, comprehensive projects. By identifying high-value use cases, organizations can generate quick wins, building credibility for future data projects.
As we move forward, the orchestration of data management must prioritize clarity and context. By fostering an environment where information flows seamlessly across silos, organizations can unlock the true potential of their data initiatives. Remember, data should not just be about numbers—it should translate into strategic business value.
In this complex landscape, it’s crucial to engage all stakeholders and maintain alignment between technical teams and business needs. Only then can we hope to navigate the data paradox effectively.
Losing Context: The Journey from Raw Data to Business Insight
In my journey through the world of data management, I’ve noticed something startling. Raw data isn’t just numbers and letters. It’s a treasure trove of potential insights, waiting to be unlocked. But what happens when we lose the context that gives this data meaning? The truth is, without context, data is like a book without a story. It simply doesn’t resonate.
What Does Raw Data Look Like?
Raw data is often just a jumble of facts. Think of it as the unassembled pieces of a puzzle. For instance, you might have sales numbers, customer demographics, and product details scattered across various files. But, on their own, these figures mean little. They lack the story that connects them to your business goals.
On the other hand, actionable knowledge is like the completed puzzle. It tells a story. It helps us understand customer behavior, market trends, and operational performance. When we transform raw data into actionable insights, we create a narrative that can guide decision-making.
The Transformation Process and Its Pitfalls
The process of transforming raw data into knowledge is fraught with challenges. Each step—collecting, processing, analyzing—presents opportunities for context to slip away. As data travels from one department to another, its meaning can get lost in translation. This is a common pitfall.
Imagine a major retail chain that invested heavily in a customer data platform. They gathered vast amounts of transaction and demographic info. But when store managers received these insights, they found them lacking. The data didn’t answer their critical questions about enhancing the customer experience. This gap illustrates a significant failure in maintaining context during the transformation process.
Real-World Examples of Context Loss
Let’s take another example from healthcare. A healthcare organization integrated a sophisticated data warehouse. They aimed to support clinician workflows. However, the insights produced were disconnected from the actual clinical needs. This disconnect led to frustration among staff and ultimately compromised patient care.
These examples highlight a critical issue: when the context of data is lost, it can lead to misguided decisions, wasted resources, and missed opportunities. It’s a pattern that can plague any organization if we’re not careful.
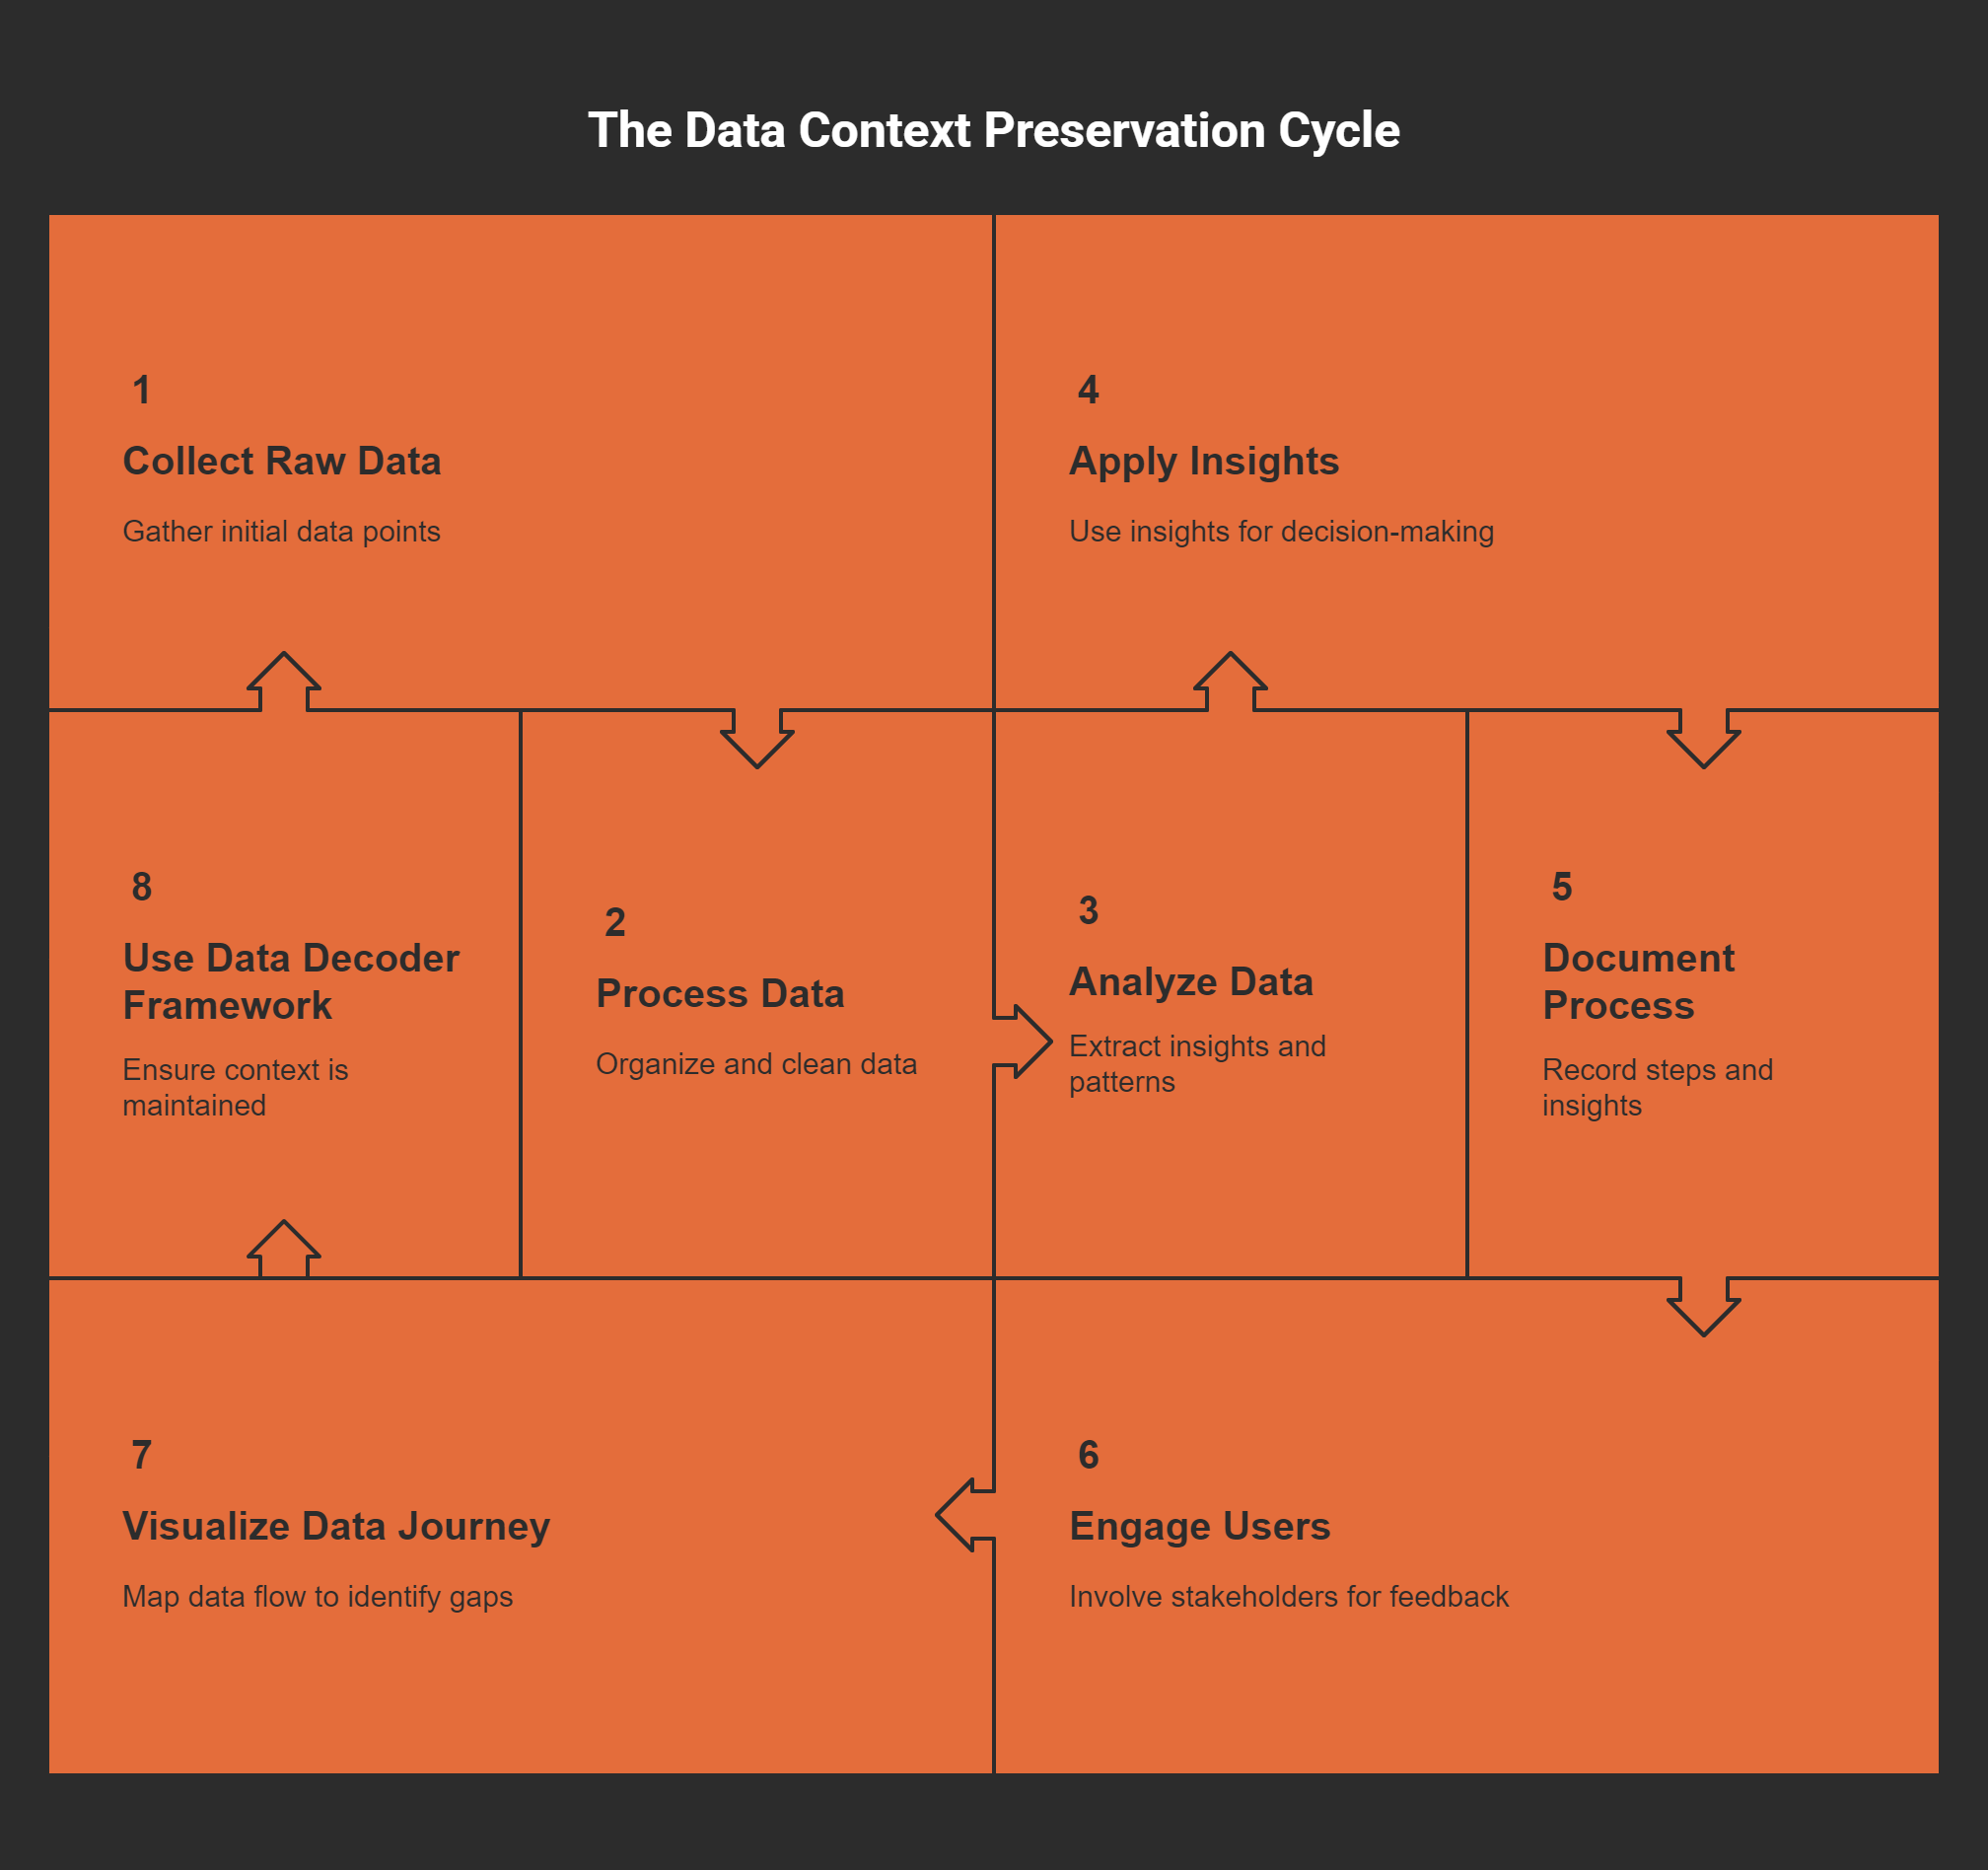
Ways to Ensure Business Context Is Preserved
So, how can we avoid losing context? Here are a few practical strategies:
Document Everything: Clear documentation is essential. It helps everyone understand the meaning behind the data.
Engage Users: Involve users from different departments in the process. Their insights can help ensure that the data remains relevant.
Visualize the Data Journey: Create a map of how data flows through your organization. This will help identify where context might be lost.
Use a Data Decoder Framework: This innovative approach highlights how data transforms and maintains its meaning throughout its journey.
By implementing these strategies, we can create a culture where data retains its context. This not only enhances decision-making but also builds trust across departments. When everyone understands the story behind the data, we can leverage insights more effectively.
As I reflect on these ideas, I’m reminded of a quote that resonates deeply: “Data without context is like a book without a story.” It’s a reminder that context is not just an added benefit; it’s essential for turning raw data into real business insight.
In a world overflowing with data, preserving its context could be the key to unlocking its full potential. Let’s commit to ensuring that our data remains meaningful, relevant, and actionable.
Mapping the Data Journey: Visibility is Key
Have you ever tried navigating a city without a map? It’s confusing, right? You might find yourself lost, unable to find the best route to your destination. Now, imagine trying to navigate a data system without a clear understanding of its flow. It feels just as chaotic. In today’s world, where data drives decisions, visualizing that data flow within an organization is crucial.
The Importance of Visualizing Data Flow
Organizations often invest heavily in data initiatives, yet many fail to reap the benefits. Why is that? One reason is the lack of visibility into how data moves and transforms throughout the organization. Many teams view data as a mere technical asset, forgetting its inherent business context. What if we could create a clear map of our data journey?
Visualizing data flow helps identify where data exists and how it evolves.
It preserves the business meaning of data at every step.
It enables teams to see who interacts with the data and how.
As I delved into this concept, I came across a quote that resonated deeply:
“Just as a map helps navigate unfamiliar territory, we need a way to visualize data flow across an organization.”
This perspective emphasizes the importance of a well-structured visualization in managing data effectively.
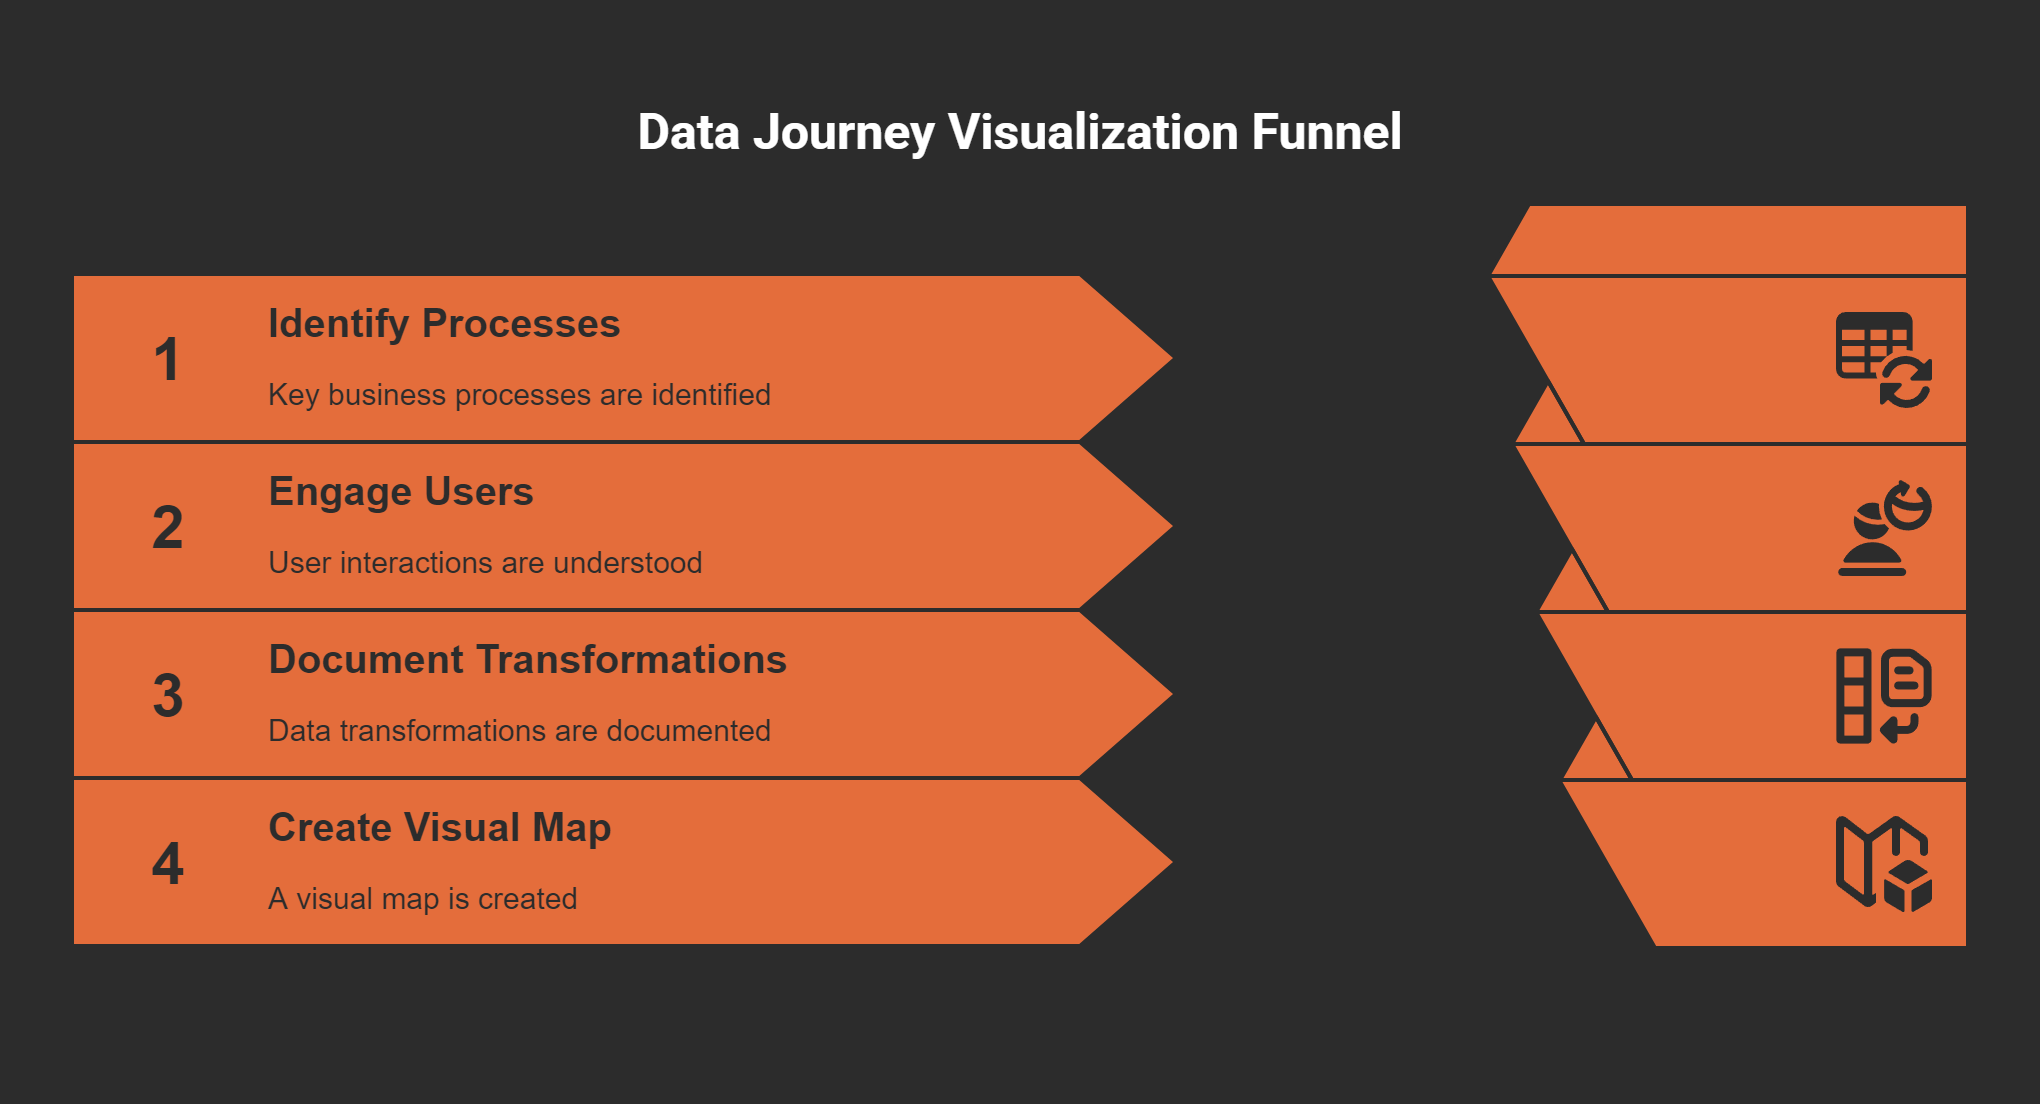
Creating a Map of User Interactions and Data Transformations
So, how do we go about creating this visual representation? It starts with understanding user interactions and the transformations that data undergoes. Think of it as charting the course of a river. The source is the initial data input, and as it flows, it transforms through various channels—departments, systems, and processes—until it reaches its destination.
Identify key business processes that rely on data.
Engage with users across departments to understand their interactions with data.
Document the origin and transformation of data elements.
Create a visual map that highlights these interactions and transformations.
This mapping process doesn’t just clarify the journey of data; it also helps in spotting points of disconnect, where the data’s meaning may get lost. For instance, if a sales team doesn’t understand the insights generated from customer data, the potential value of that data diminishes. This is often where organizations stumble, leading to wasted resources and missed opportunities.
Identifying Points of Disconnect in Data Projects
In my experience, identifying these disconnects is just as vital as mapping the flow itself. Consider this: each step in the user journey—from the initial capture of data to its analysis—presents risks of dilution or misinterpretation. If we don’t keep the context intact, we risk making decisions based on fragmented or misleading insights.
To mitigate this, organizations need to continuously evaluate how data transforms across its journey. Are the insights relevant to the decisions being made? Are the data users equipped with the right understanding? By asking these questions, we can better manage our data projects and enhance their effectiveness.
Moreover, embracing a framework for visualizing data processes can foster a culture of collaboration. The concept of data cartography comes into play here. By treating data flow like a map, we can align technical teams with business users, ensuring everyone is on the same page.
Engaging with Our Data Journeys
As we reflect on our own data journeys, I encourage you to think about your organization’s practices. Are you visualizing data effectively? Are there gaps in understanding that need to be addressed? Engaging with these questions can lead to significant improvements in how data is handled and perceived within your organization.
Ultimately, visualizing the data journey is not just an exercise; it’s a necessity. It empowers teams, enhances decision-making, and ensures that data drives real business value. As we strive for clarity in our data practices, let’s remember to equip ourselves with the maps we need to navigate this complex landscape.
From Data-Centric to Context-Centric: A Necessary Shift
In today’s fast-paced business world, we often find ourselves drowning in data. But here’s the kicker: context matters more than the data itself. Why is that? Because data without context is just noise. It’s like a beautiful symphony without a conductor—chaotic and lacking harmony.
Why Context Matters More Than Data
Imagine trying to solve a puzzle without knowing what the final picture should look like. That’s what it’s like to work with raw data without context. We need context to interpret data effectively. It's essential for making informed decisions that drive business value.
For instance, let’s consider a major retail organization that invested heavily in a sophisticated customer data platform. They gathered a ton of transaction and demographic information. Sounds impressive, right? But when it came to enhancing the customer experience, the insights generated just didn’t answer the right questions. They were missing the context needed to translate data into actionable strategies.
Similarly, a healthcare organization integrated a vast data warehouse, expecting it to support clinician workflows. Yet, the connection between data insights and clinical relevance was weak. These examples highlight the importance of context in ensuring that data translates into real-world benefits.
Examples of Successful Shifts
Some organizations have successfully made the transition from a data-centric to a context-centric approach. They recognized that preserving the context of data as it flows through the organization is crucial. For example, companies that have embraced data journey mapping can visualize how information travels, ensuring that context remains intact at each step.
By employing data journey maps, these organizations not only identify where their data resides but also how it evolves. This visual representation acts like a roadmap, guiding teams through the complexities of data management. It’s not just about gathering data; it’s about understanding how to leverage it effectively.
Creating Roles That Bridge Technical and Business Gaps
One effective strategy is to create roles that bridge the gap between technical teams and business units. Take the concept of a data steward or a data shepherd. These roles are essential for ensuring that the context of data is preserved as it moves across different departments.
A data steward acts as a translator. They ensure that the meaning of data remains intact, adapting it so that both technical teams and business leaders can work together. This collaboration leads to better decision-making and enhances the overall value of data initiatives.
Empowering Business Units to Own Knowledge Representation
It’s also vital for business units to take ownership of their knowledge representation. When they own their data, they can provide the context needed for effective decision-making. This ownership fosters a culture of accountability, where each department understands how their data fits into the larger organizational picture.
As Natalie from SBTI Corp mentioned, recognizing users' actions and data capture points is crucial for managing data effectively. Without this awareness, organizations risk collecting data that lacks strategic value.
"To restore context to our data, we need a new way to visualize how information flows through an organization."
Strategies for Advocating This Shift
To advocate for this shift within an organization, we can start by:
Identifying key business processes that rely on data.
Engaging with users across departments to gather feedback.
Documenting the journey of data—from its origin to its analysis.
By visualizing this flow, we can clarify how to maintain meaning at every juncture. It’s about creating a clear path that everyone can follow, much like navigating a new city with a reliable map.
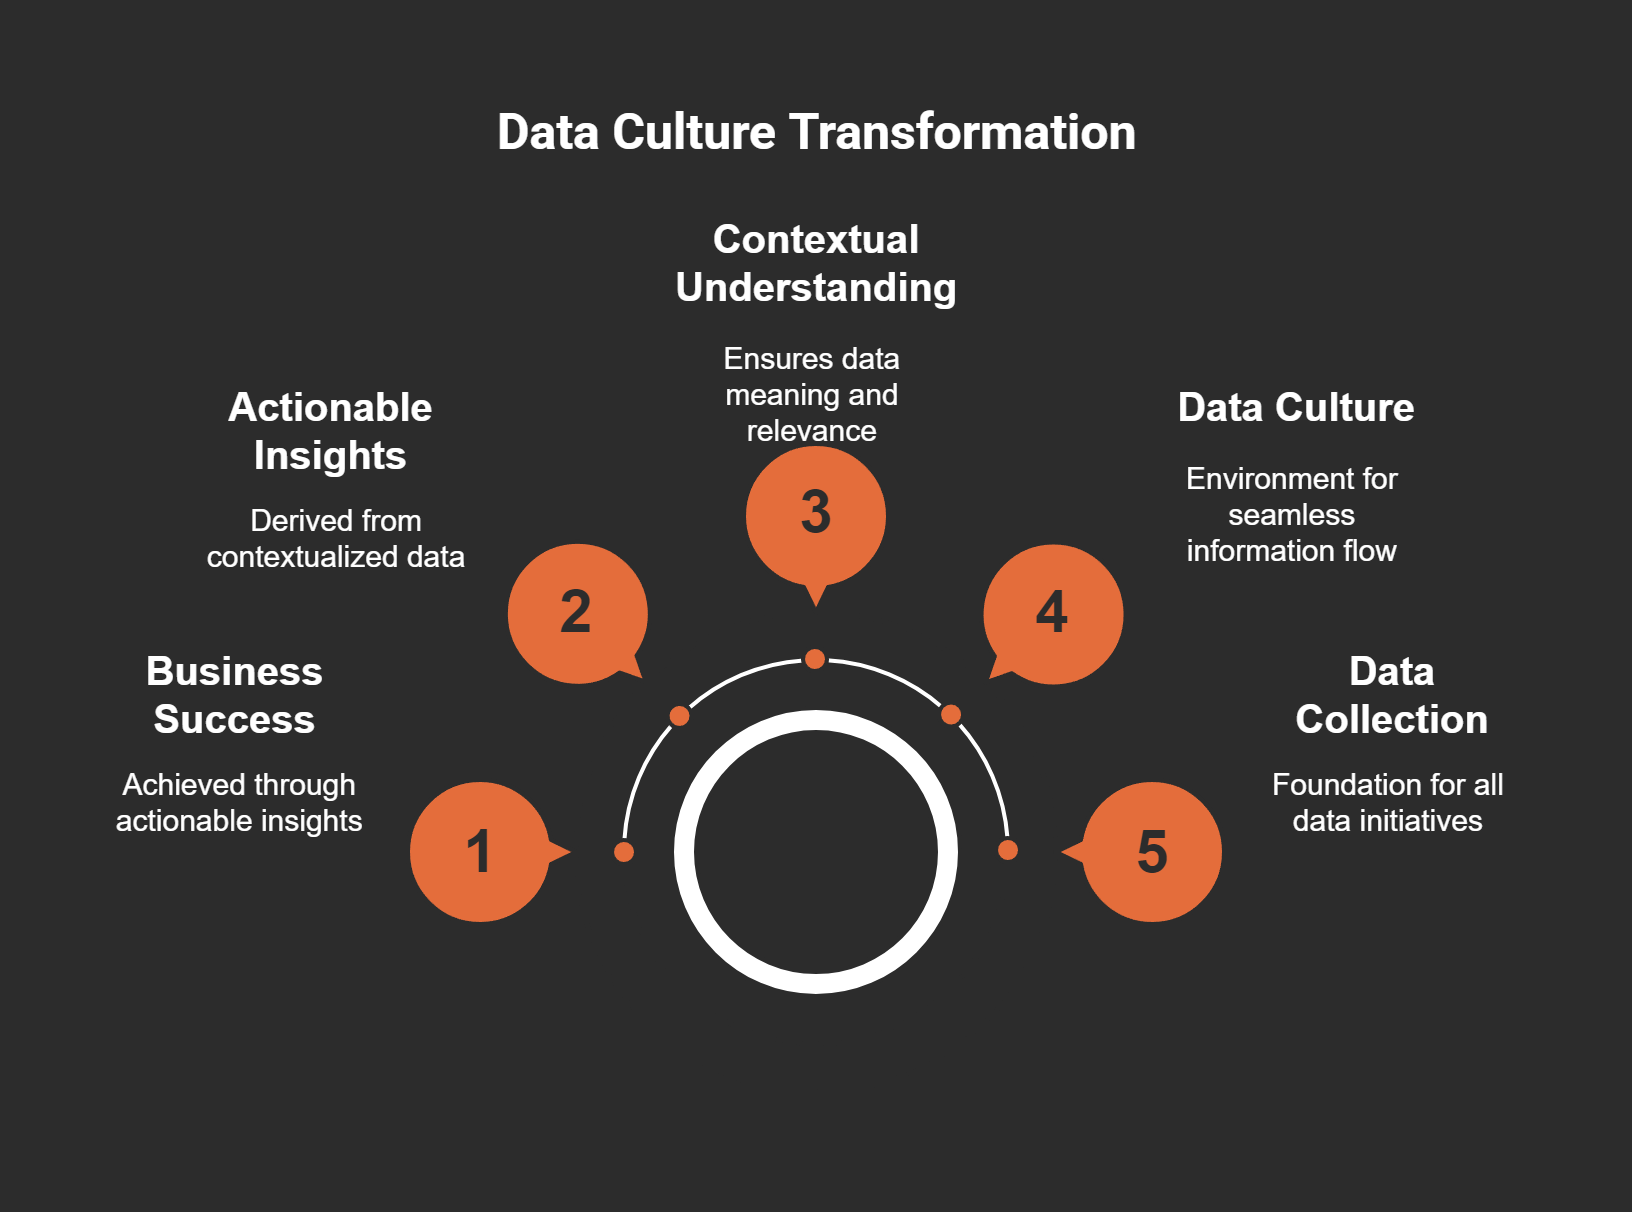
Transforming your organization’s data culture isn’t an overnight endeavor. It requires a conscious effort to ensure that context remains front and center. As we foster an environment where information flows seamlessly, we unlock the potential of our data initiatives. In the end, it’s not just about collecting data; it’s about turning it into actionable insights that drive business success.
By embracing these concepts, organizations can create a sustainable competitive advantage. When we equip business leaders with the contextual understanding they need, we pave the way for smarter decisions and greater success.


